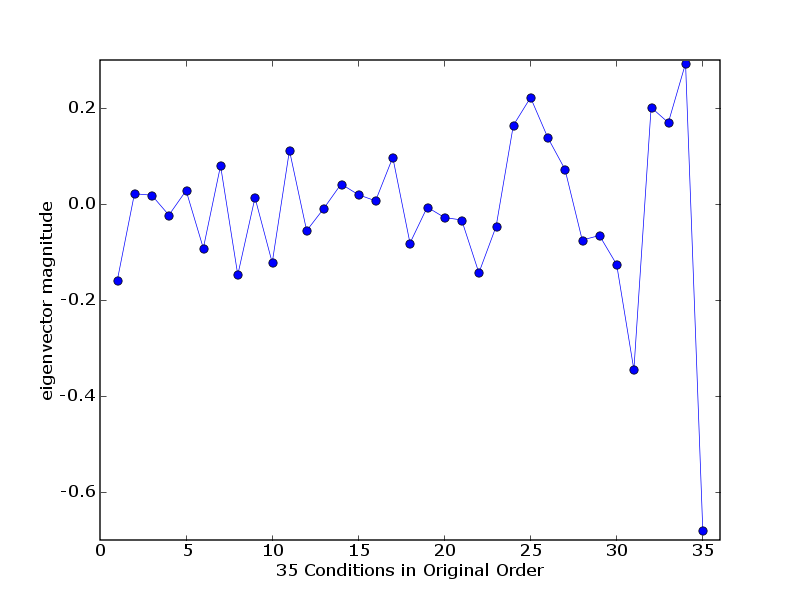
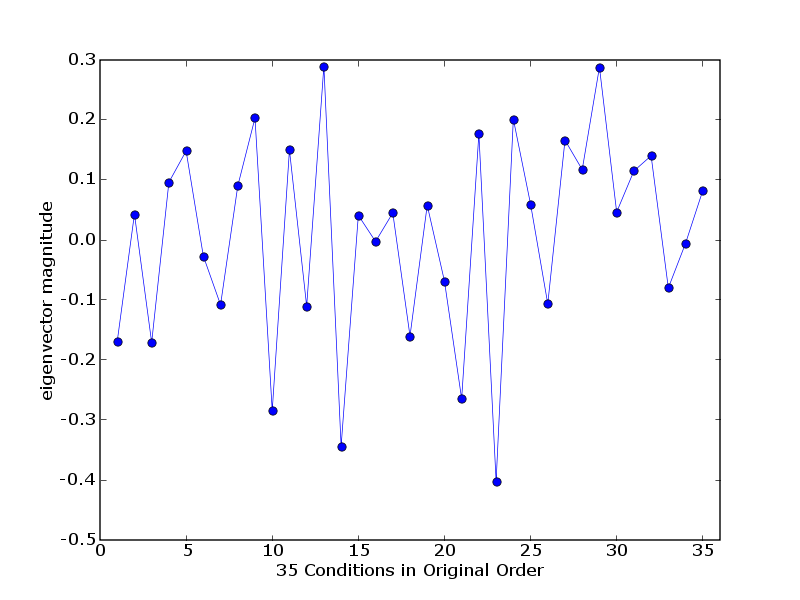
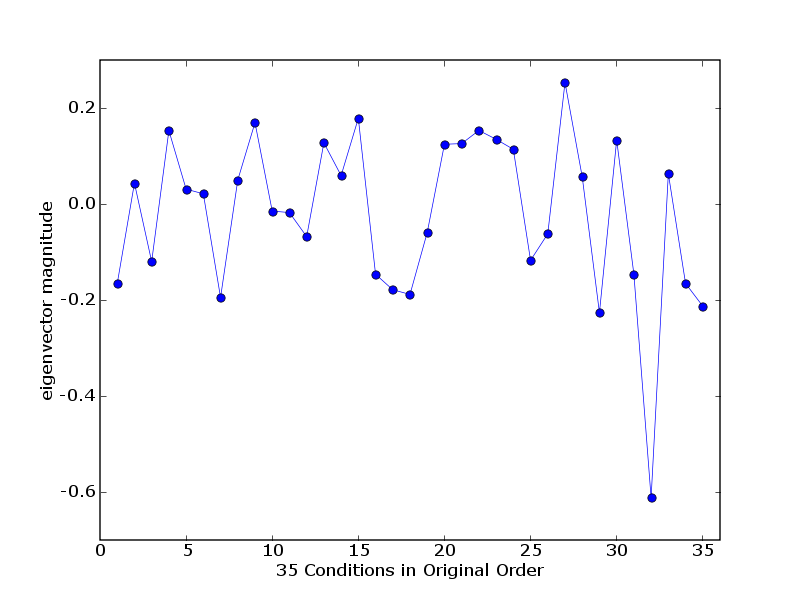
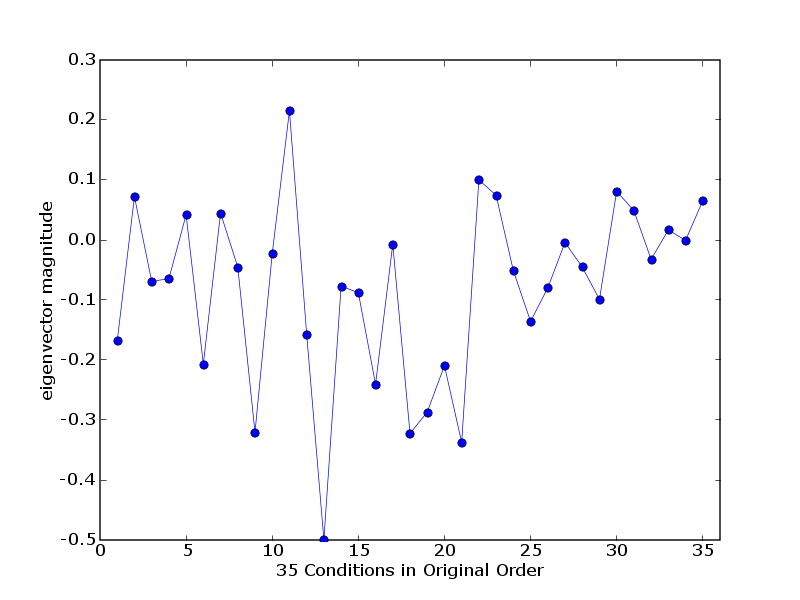
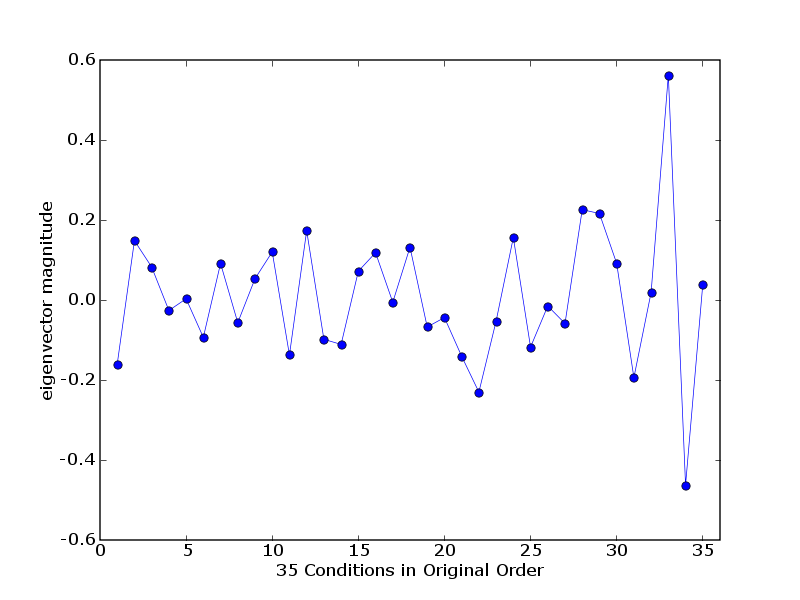
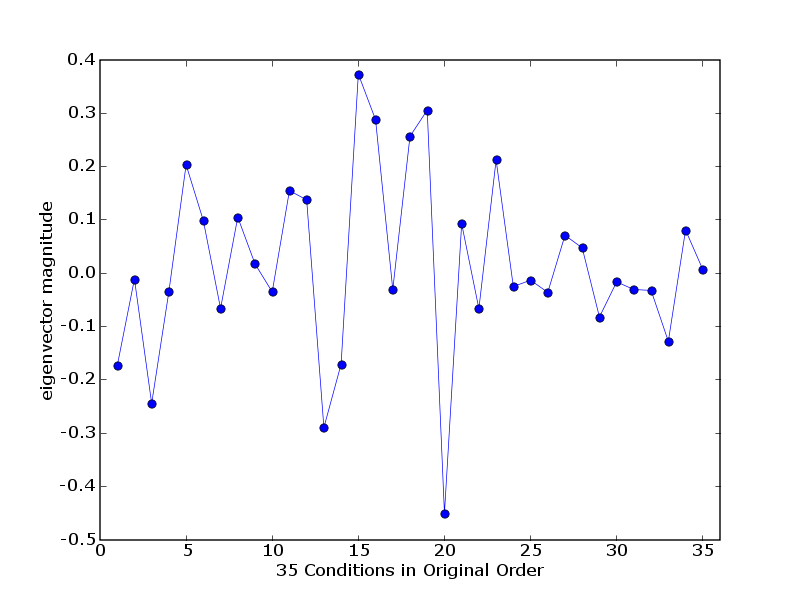
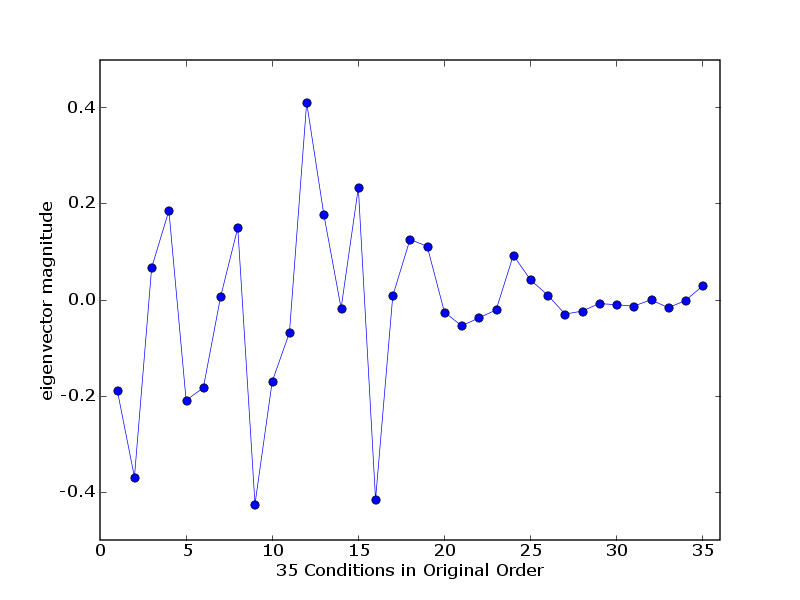
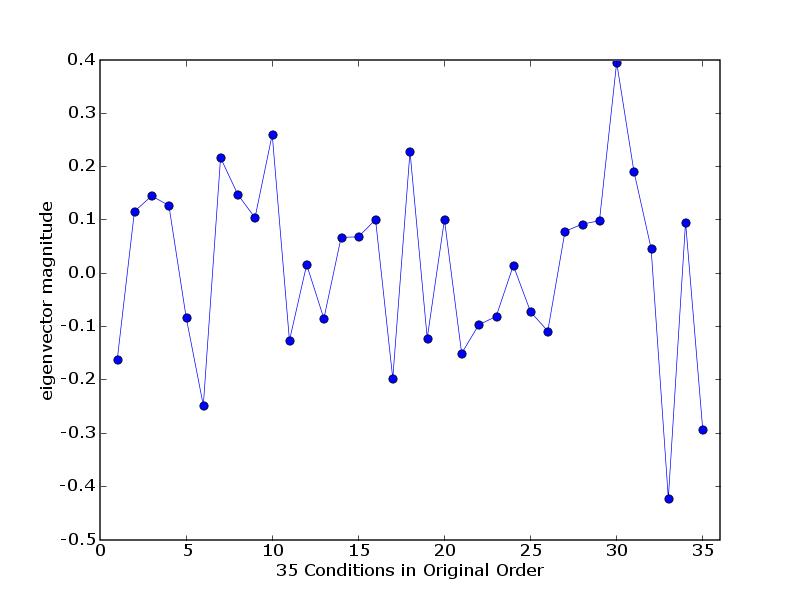
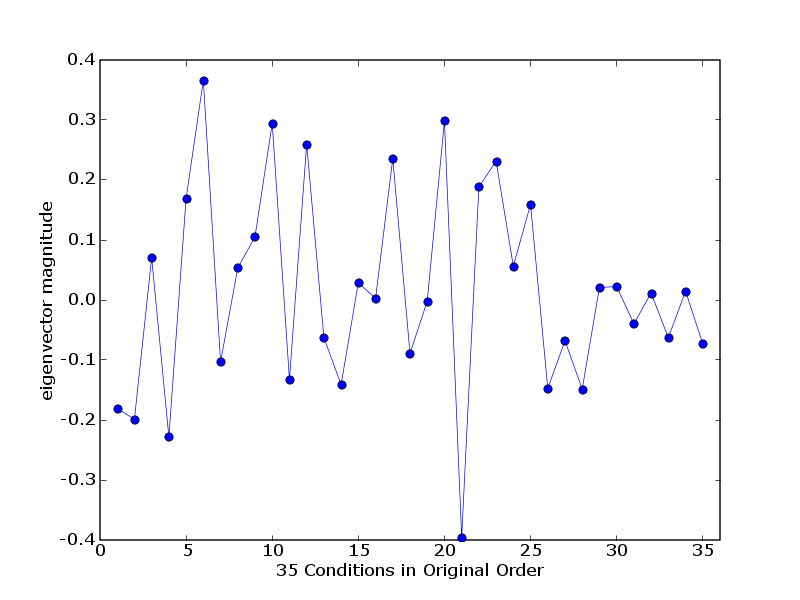
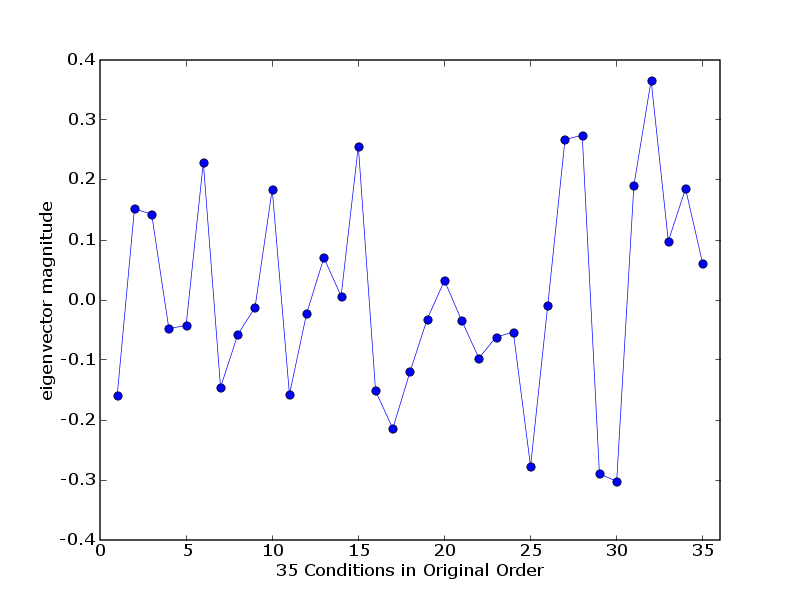
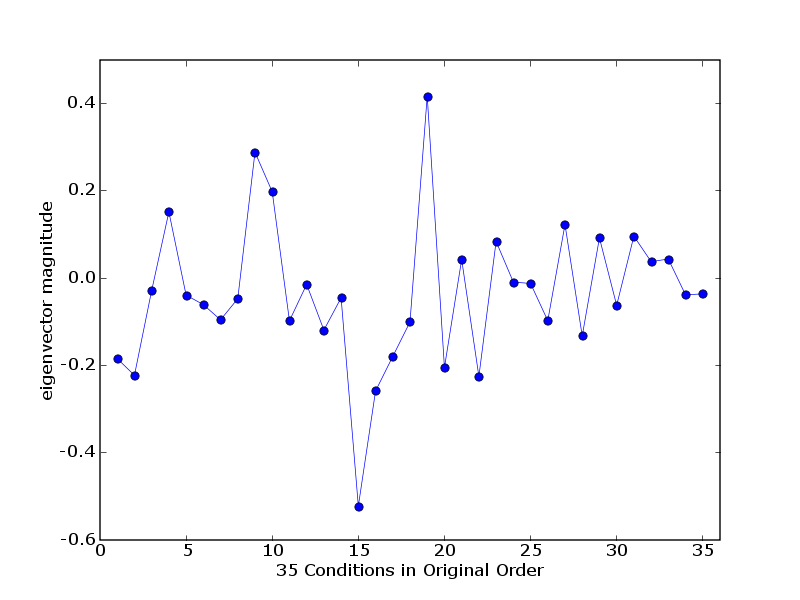
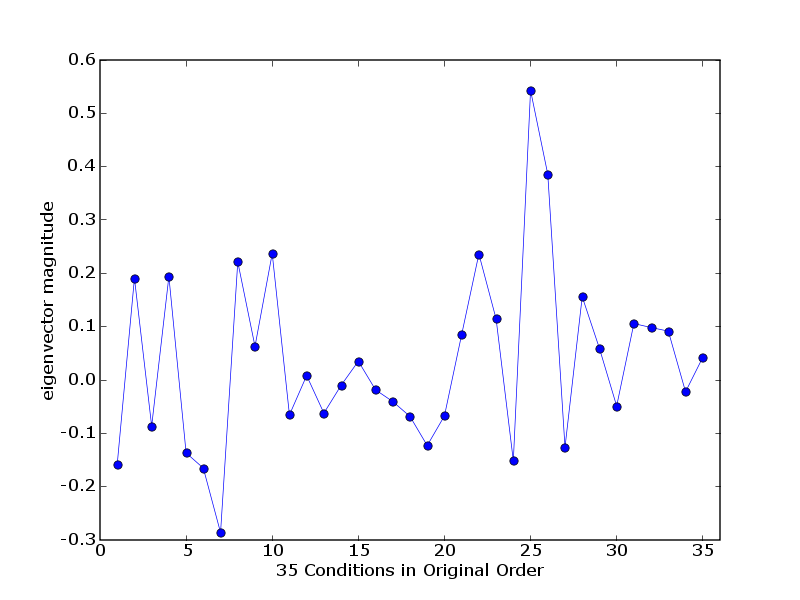
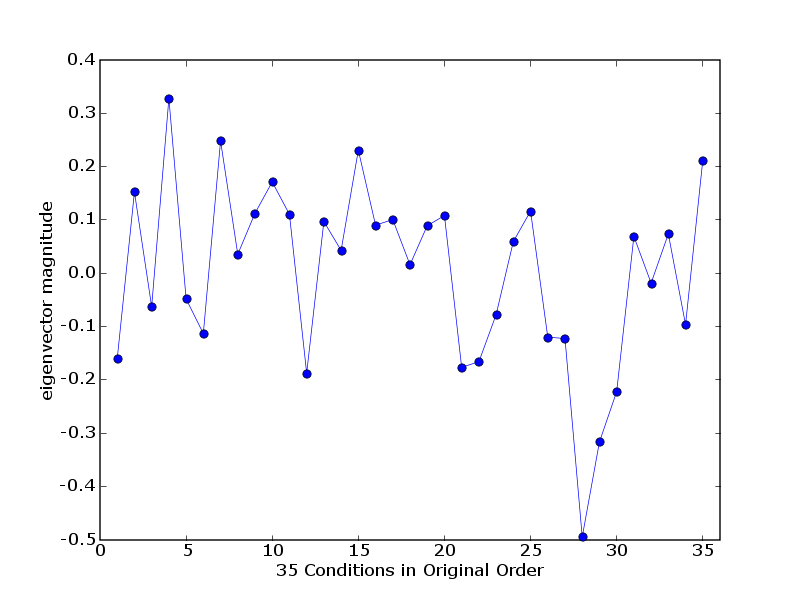
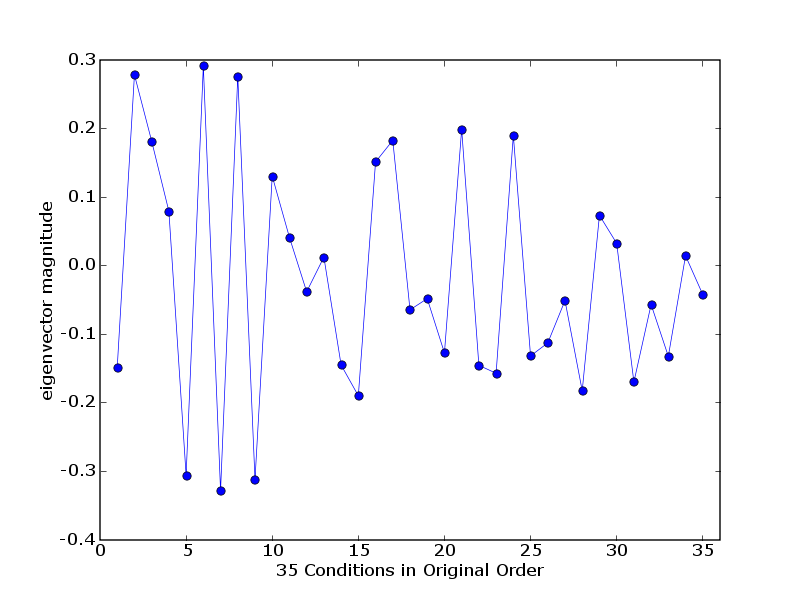
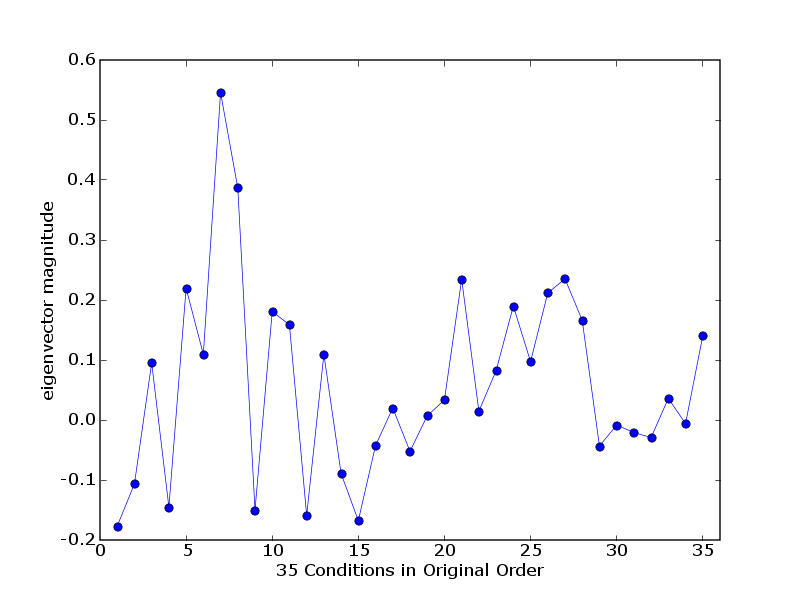
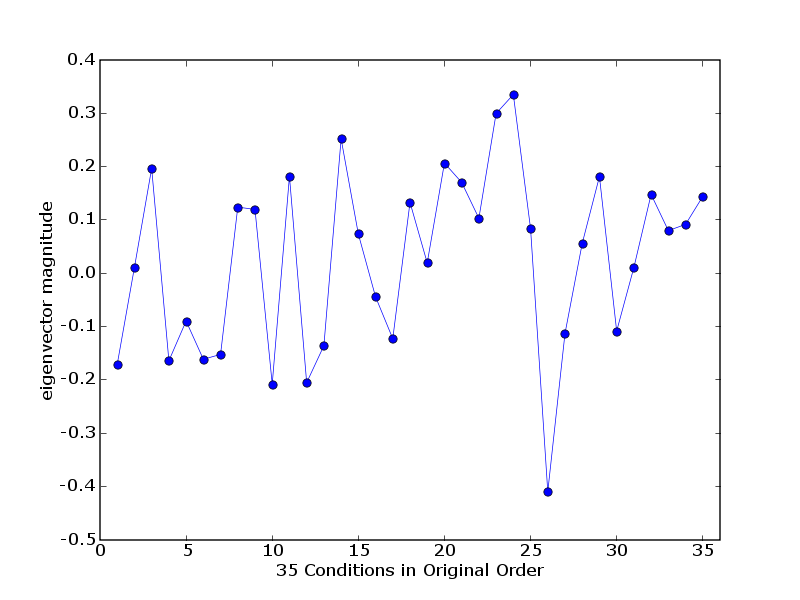
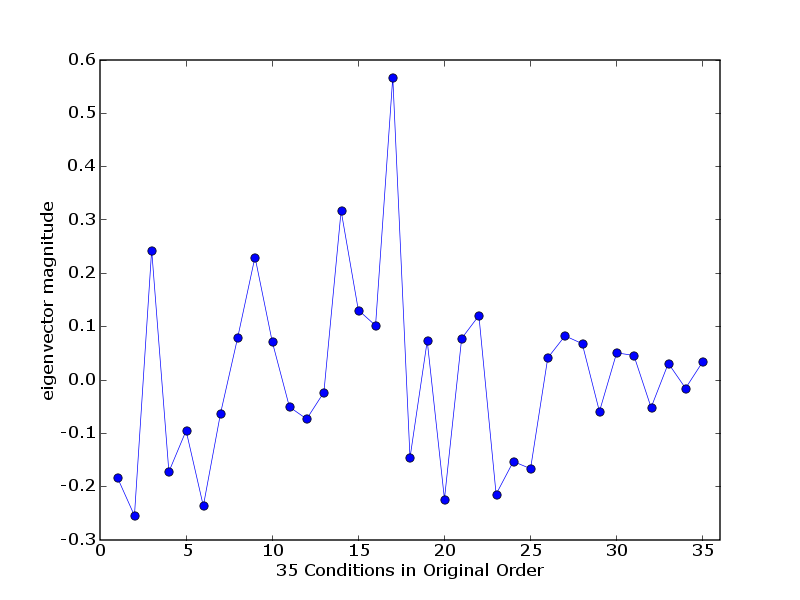
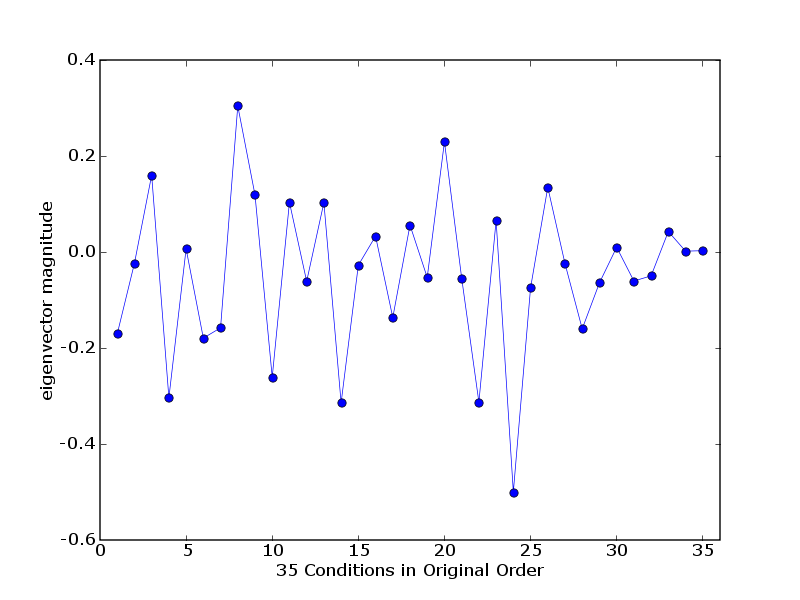
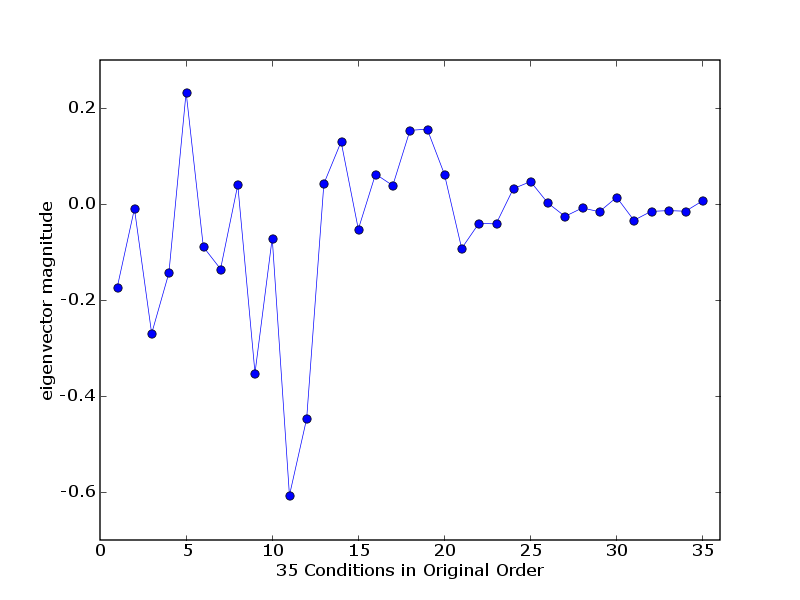
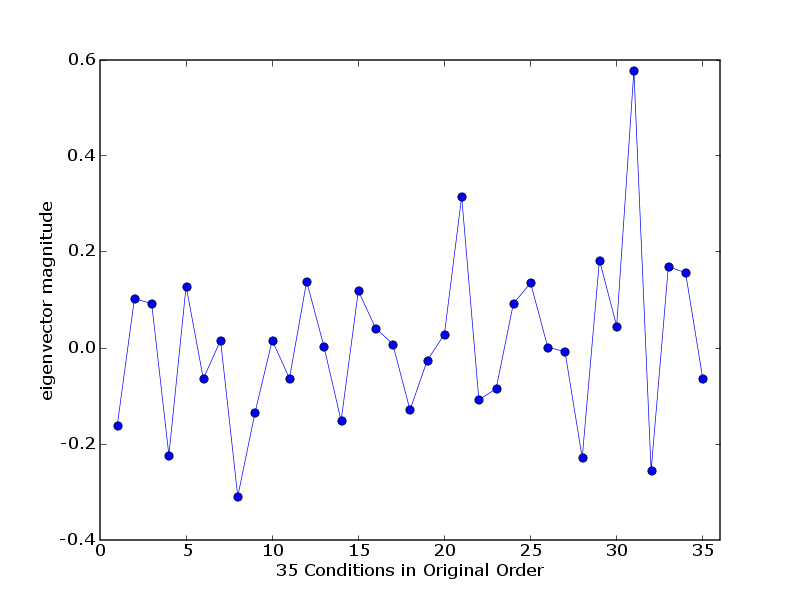
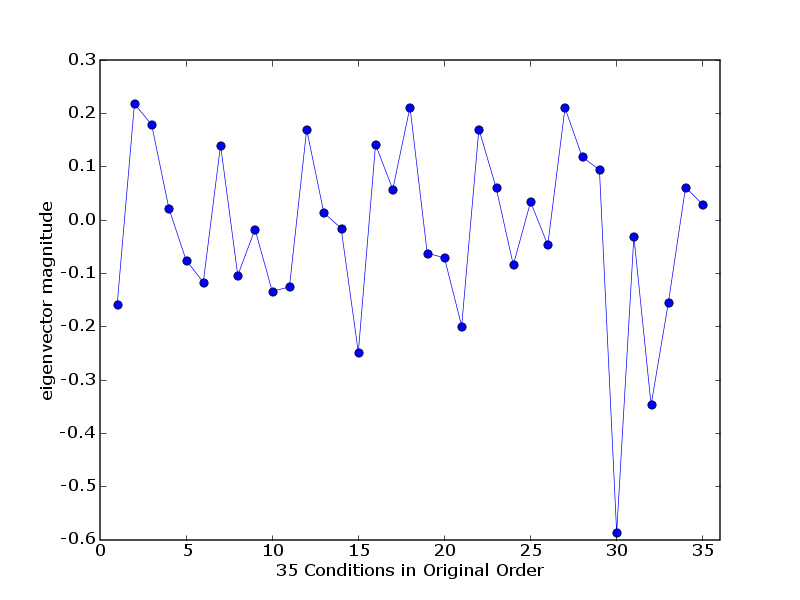
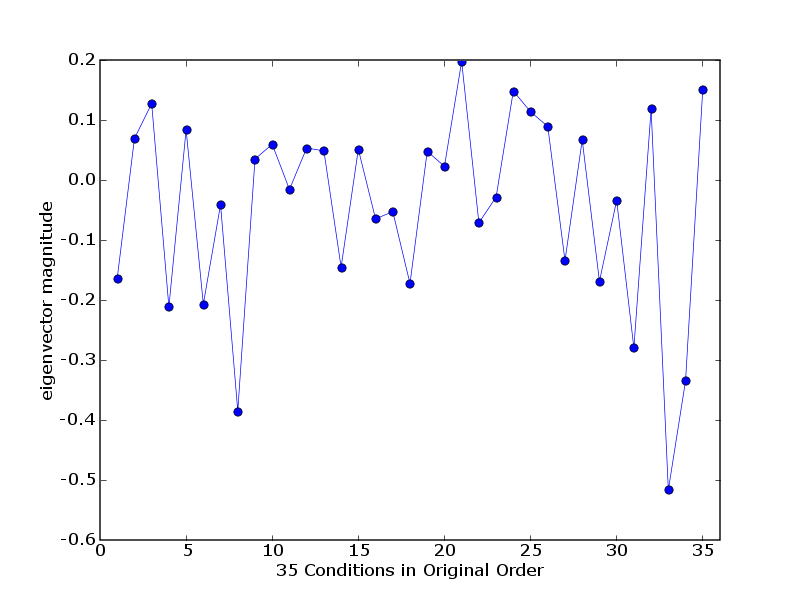
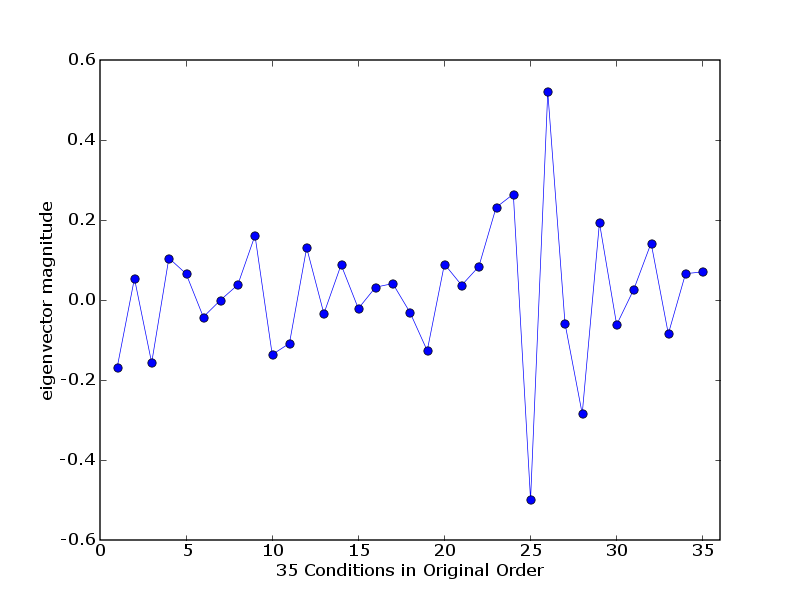
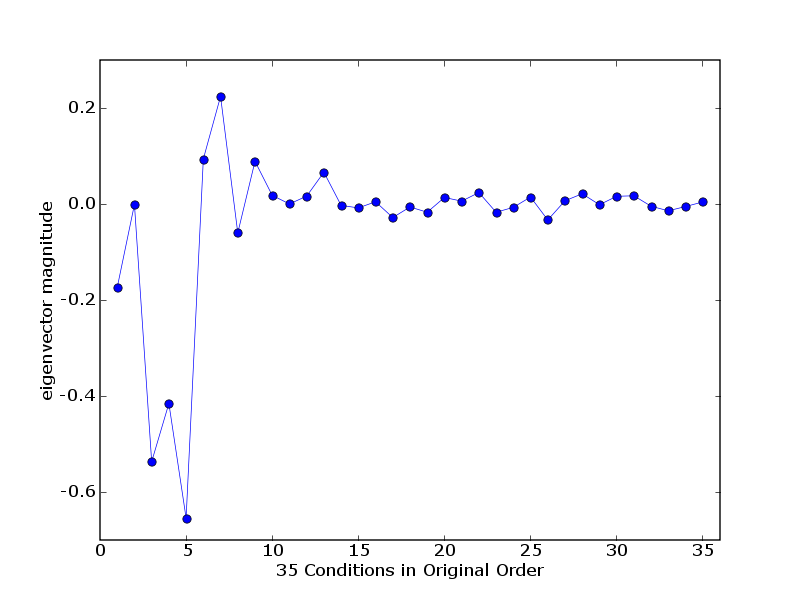
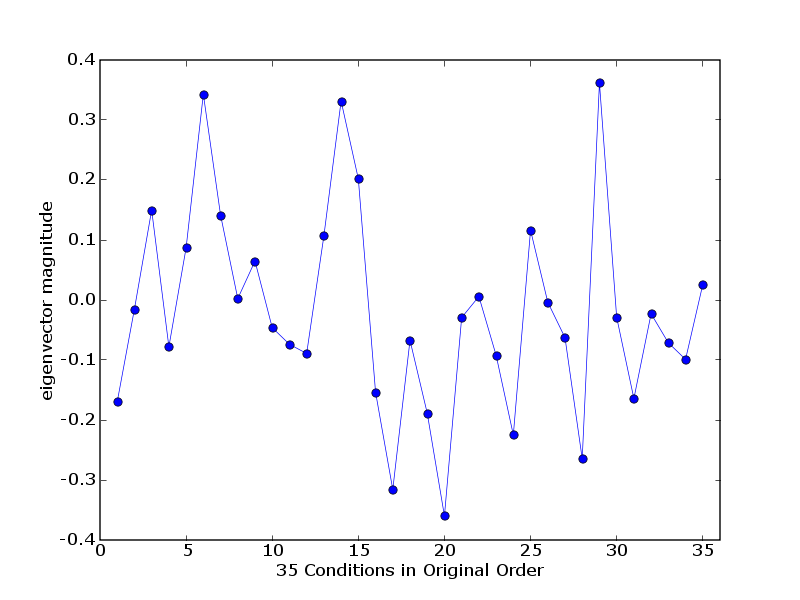
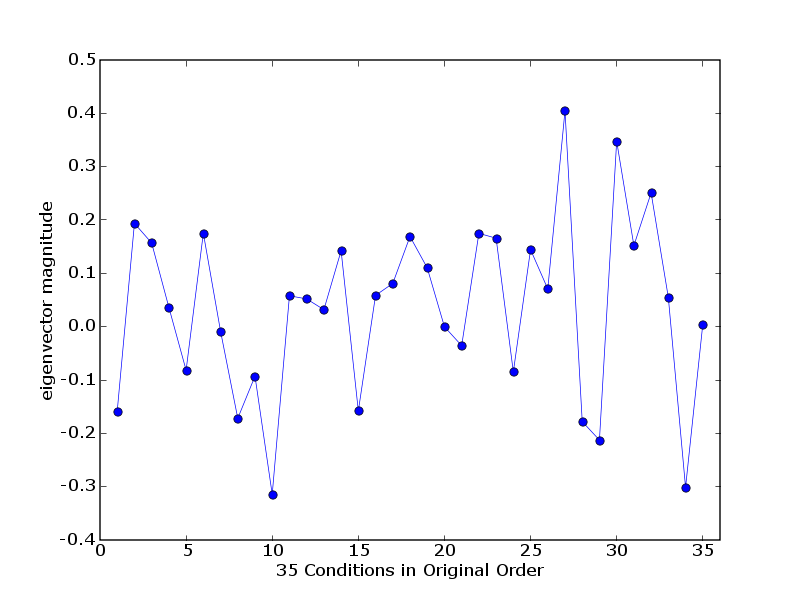
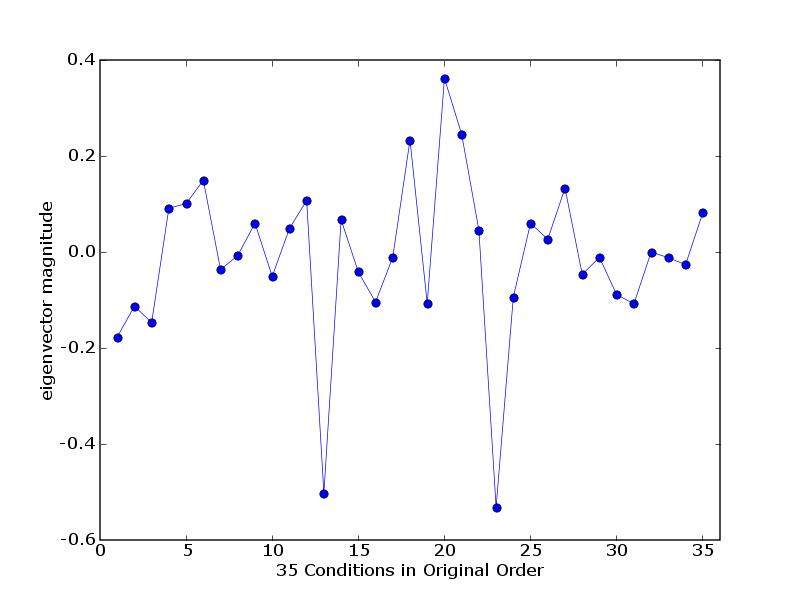
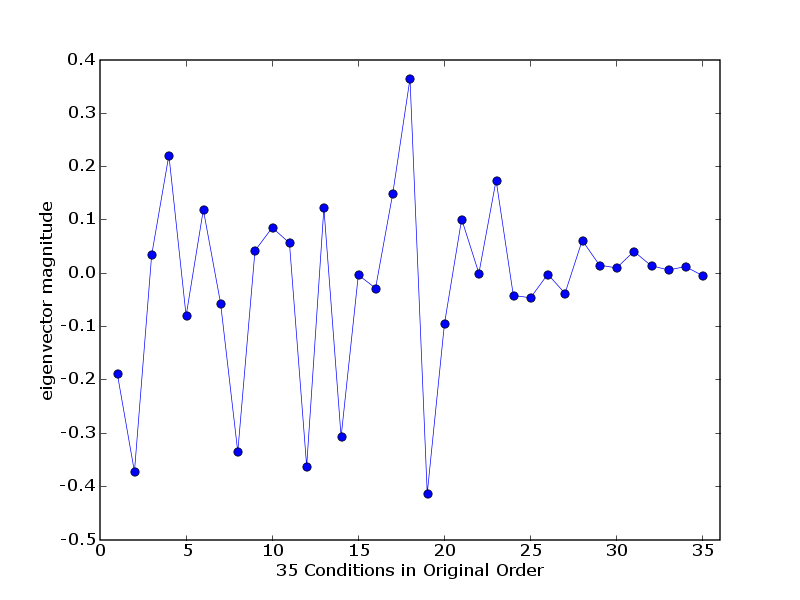
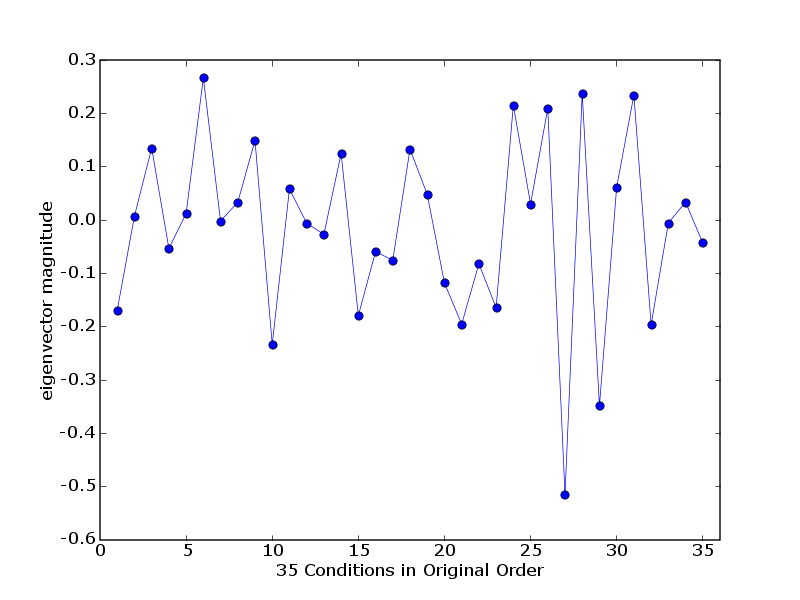
| pcNN-eigenvector.png | Plot of the eigenvector (the basis vector) showing relative weighting of conditions (tissues) for a principal component. |
| pcNN-outliers.txt | Tab-delimited text file listing the high and low principal component extreme gene (PCEG) sets for pcNN, including pcNN coefficient, and the gene identifiers, including: Name, and UID. |
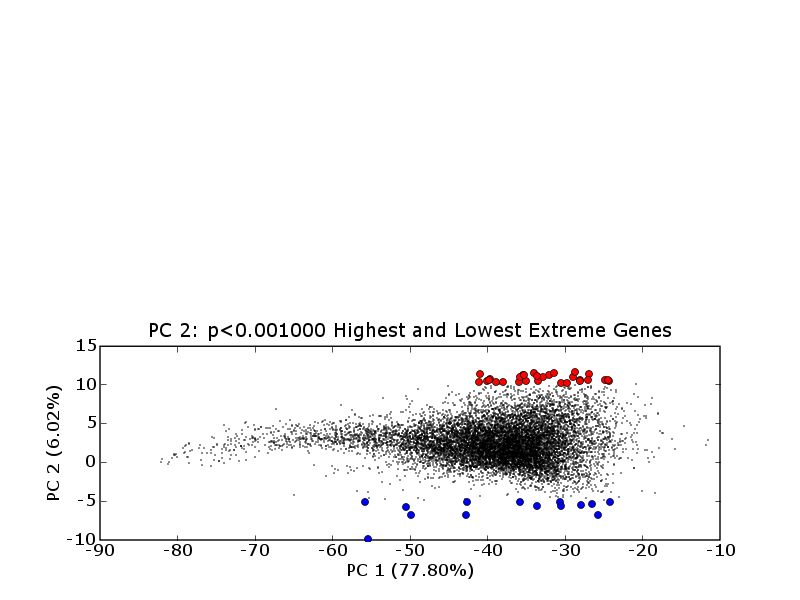
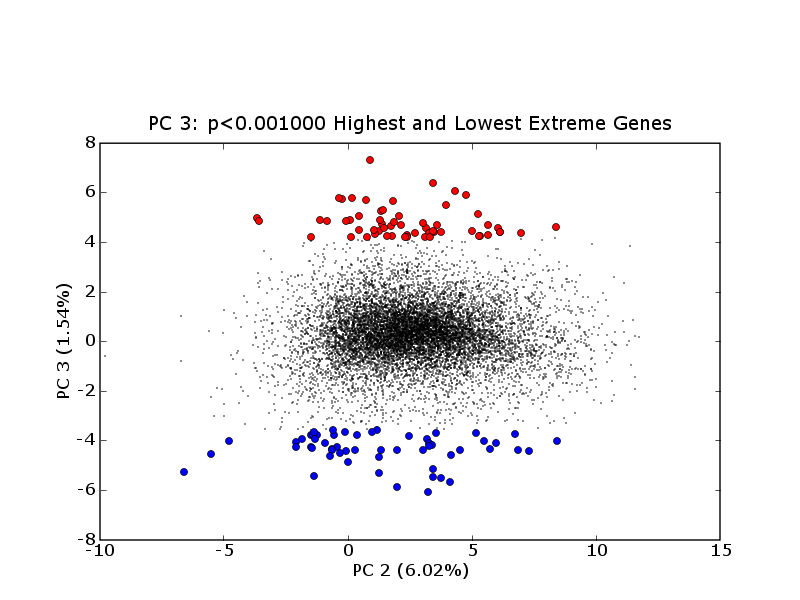
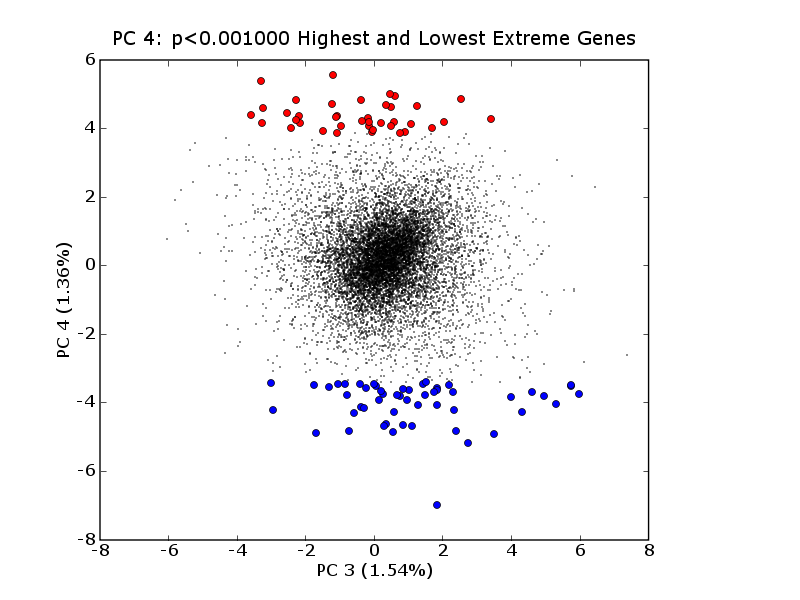
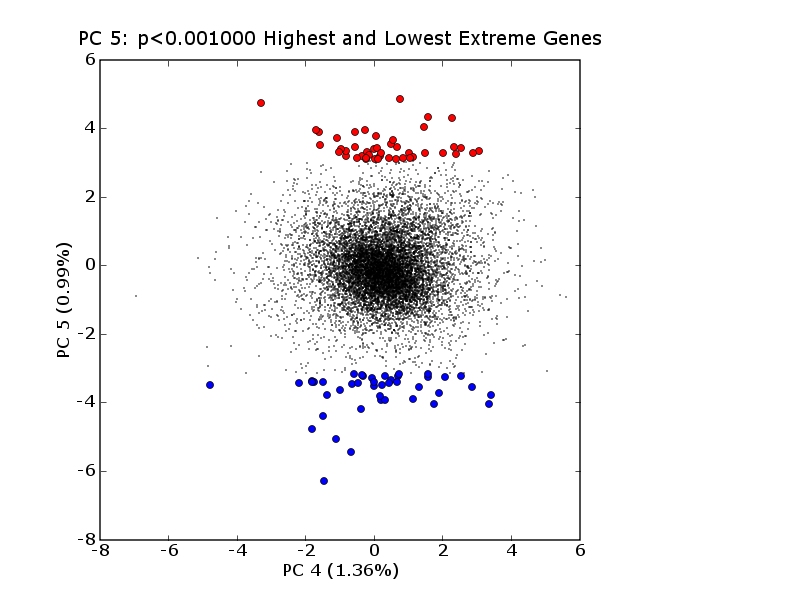
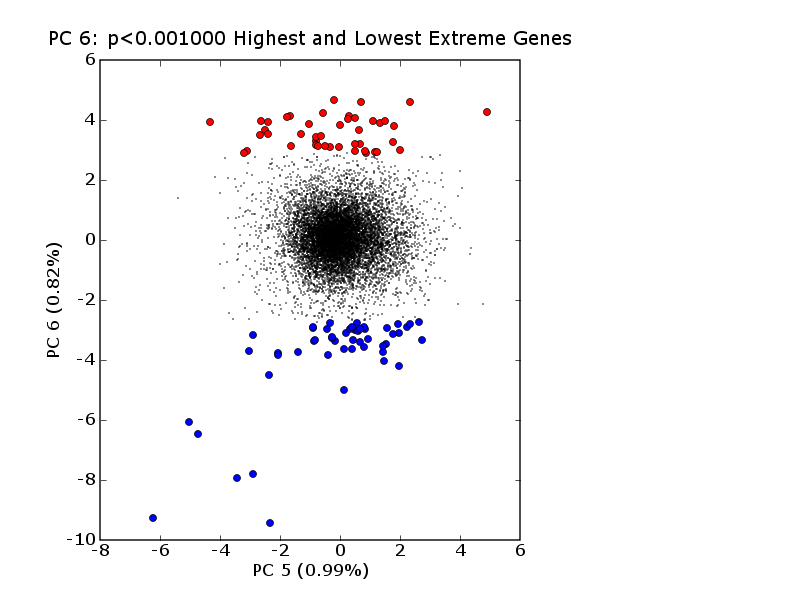
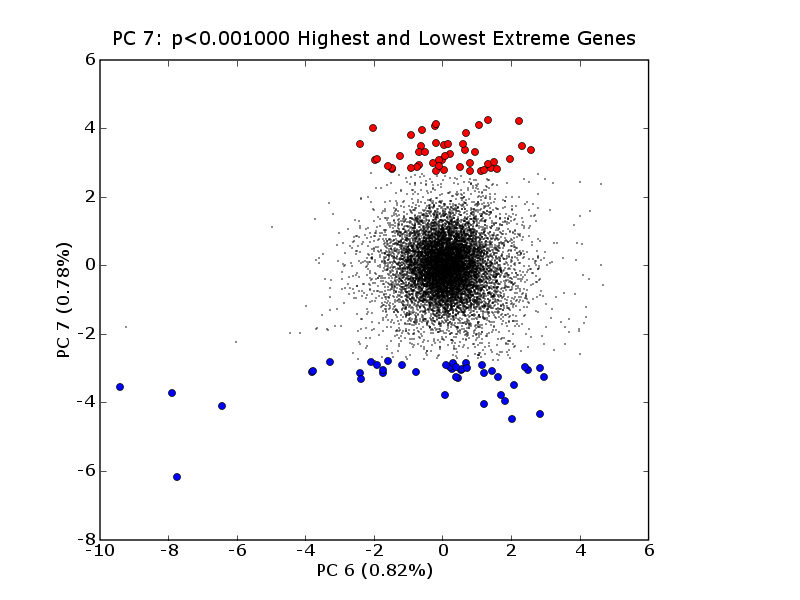
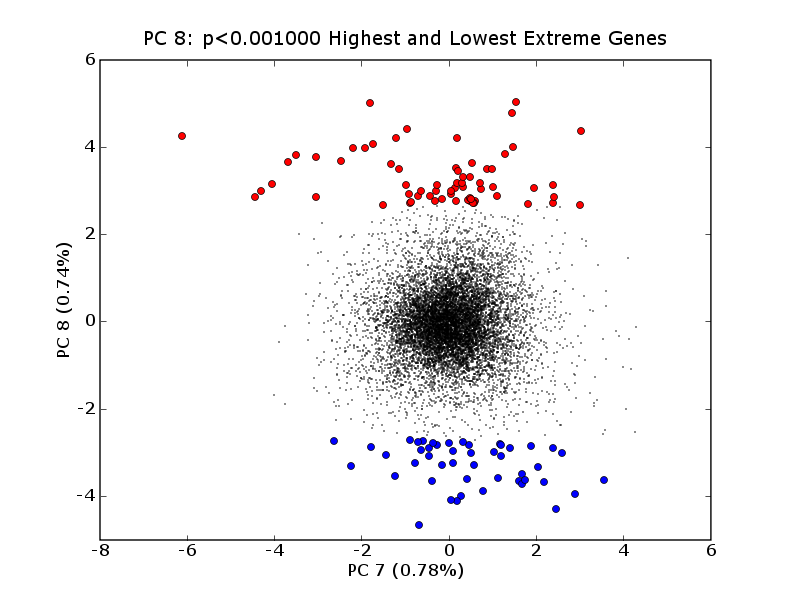
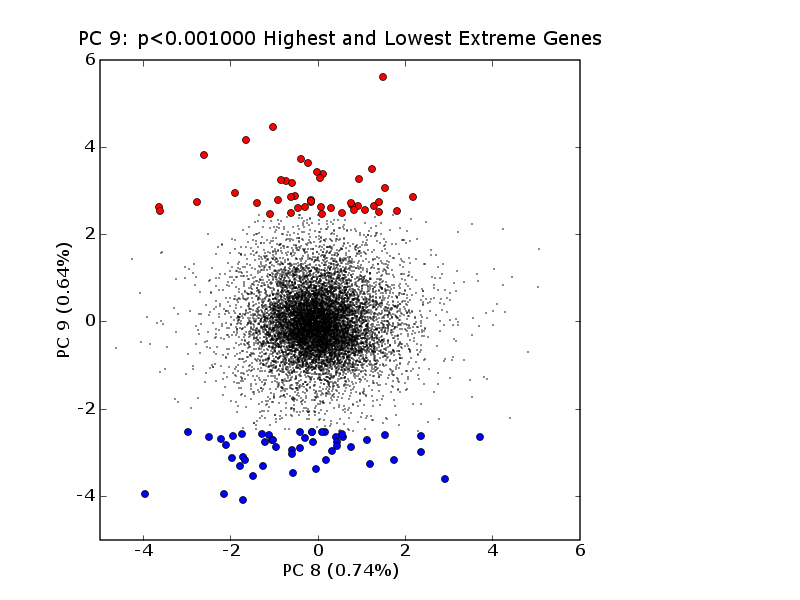
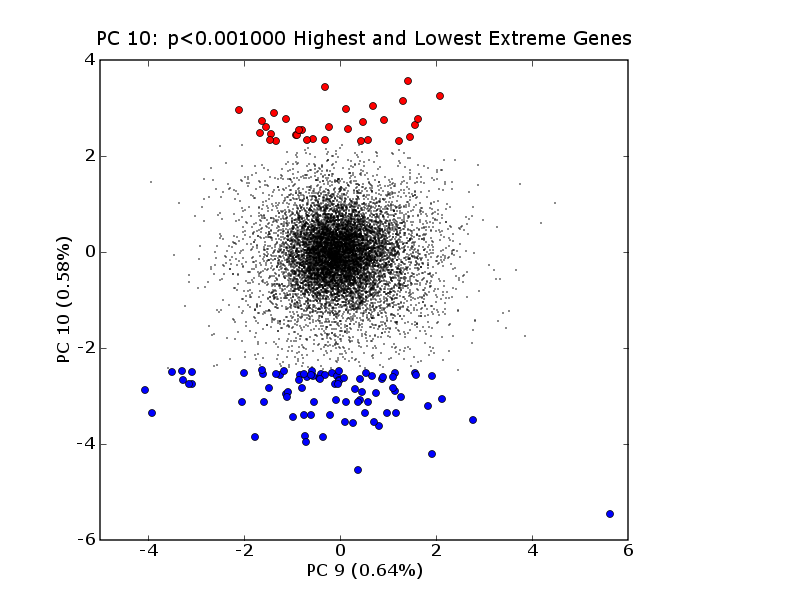
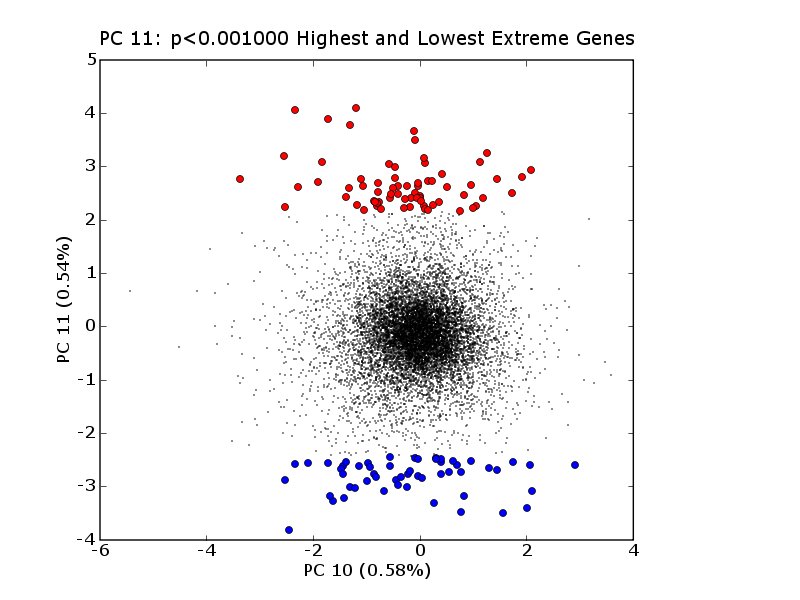
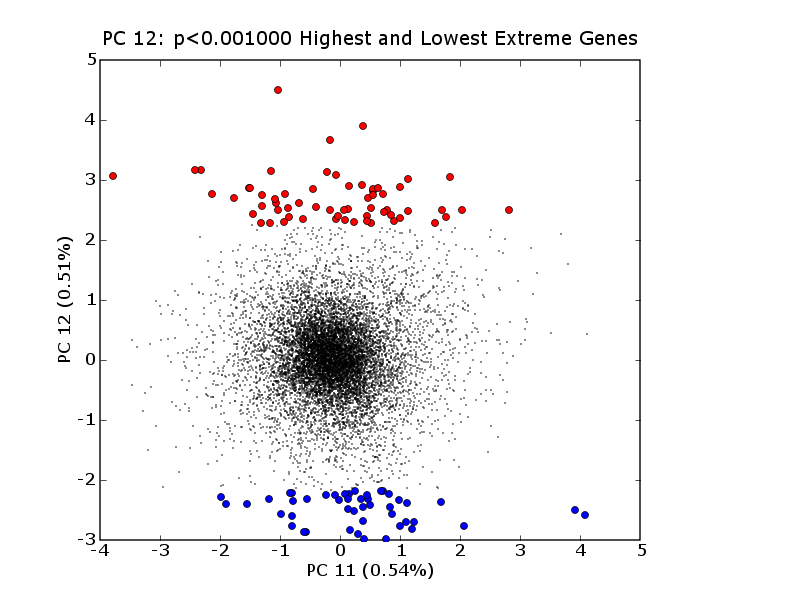
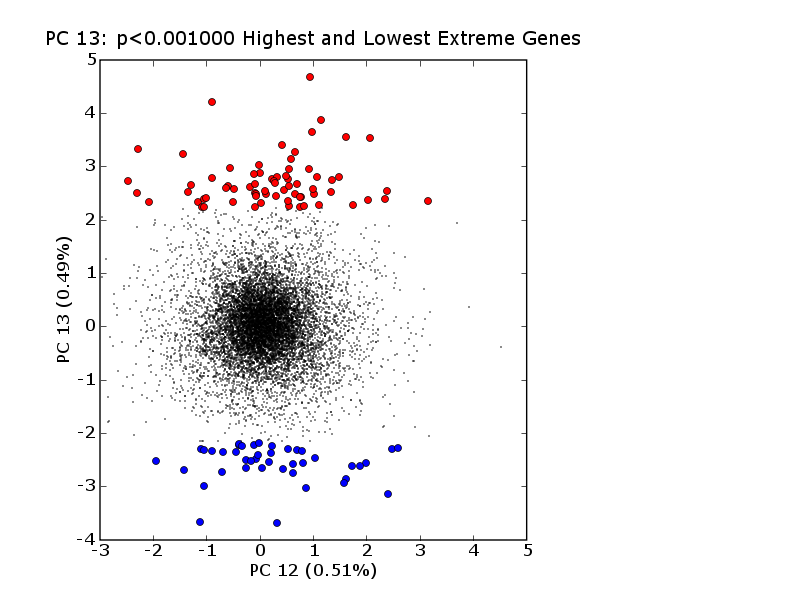
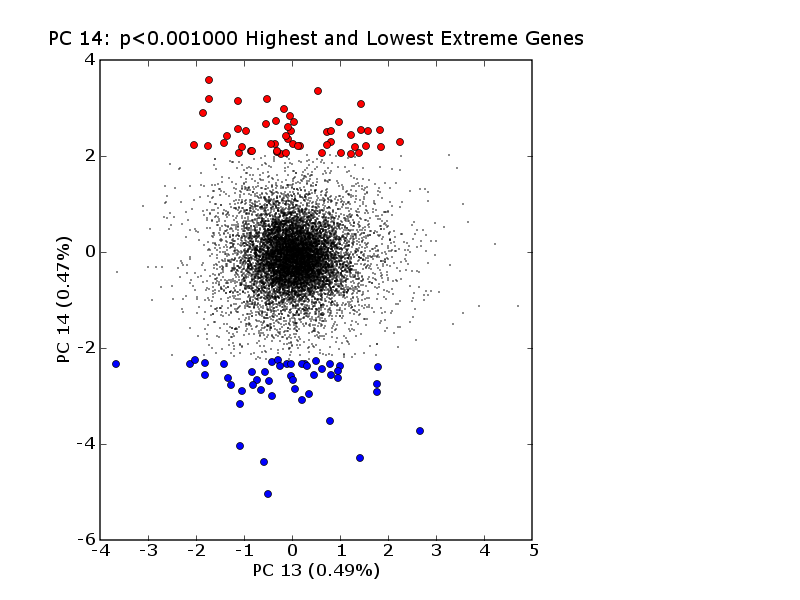
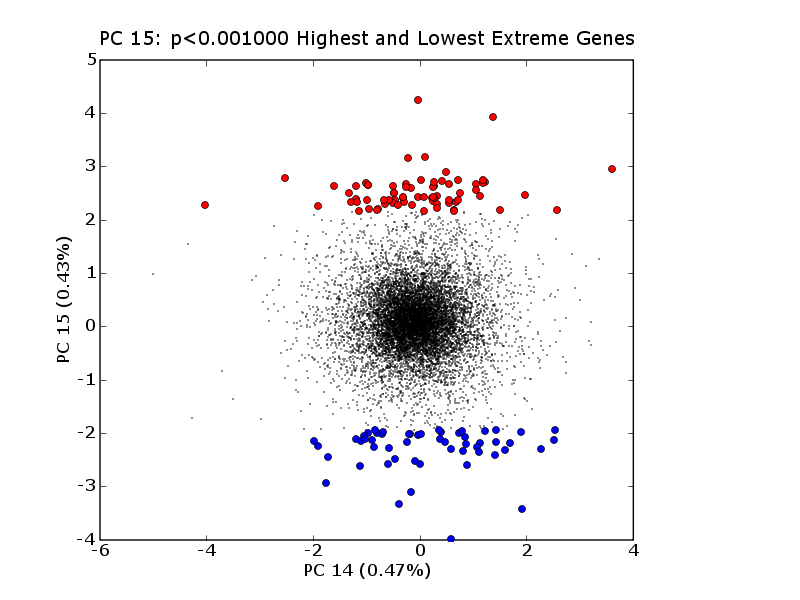
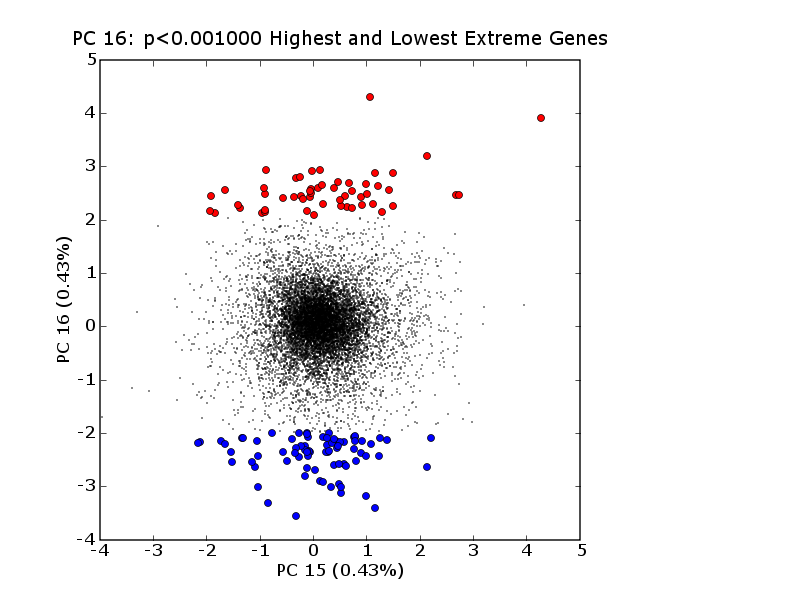
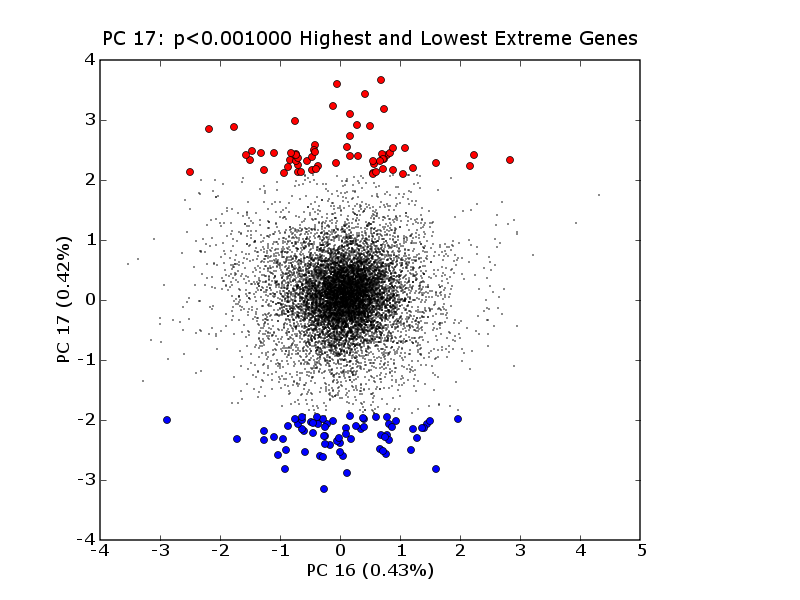
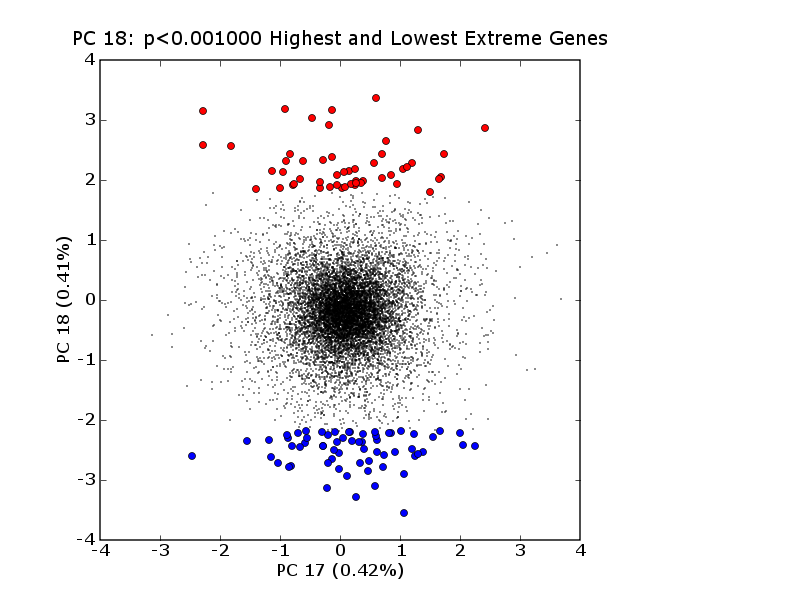
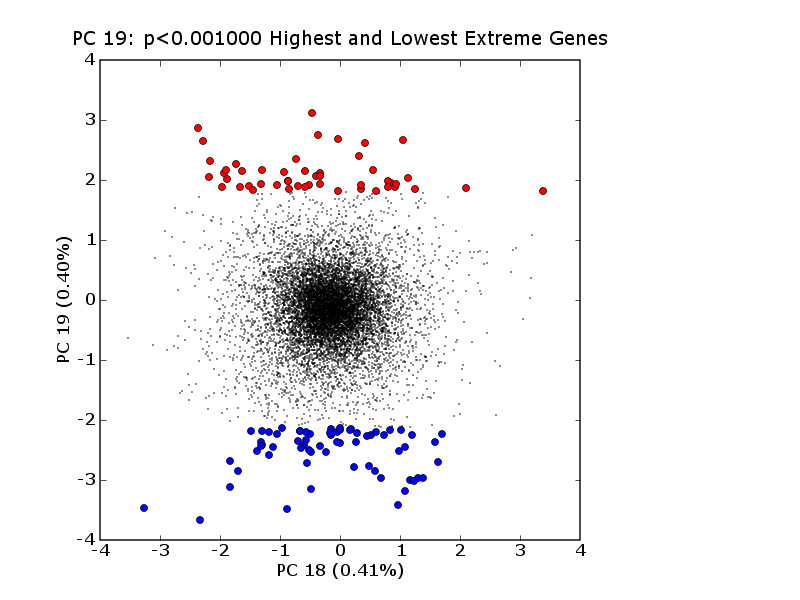
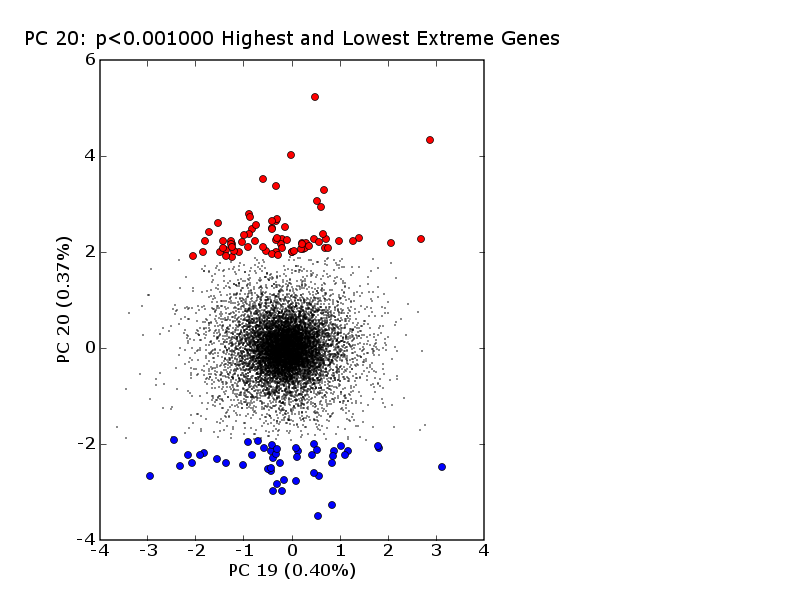
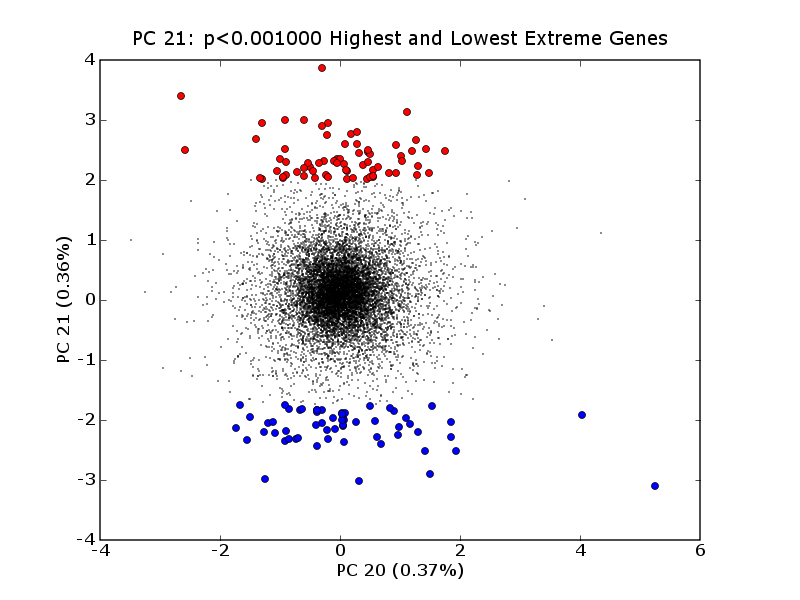
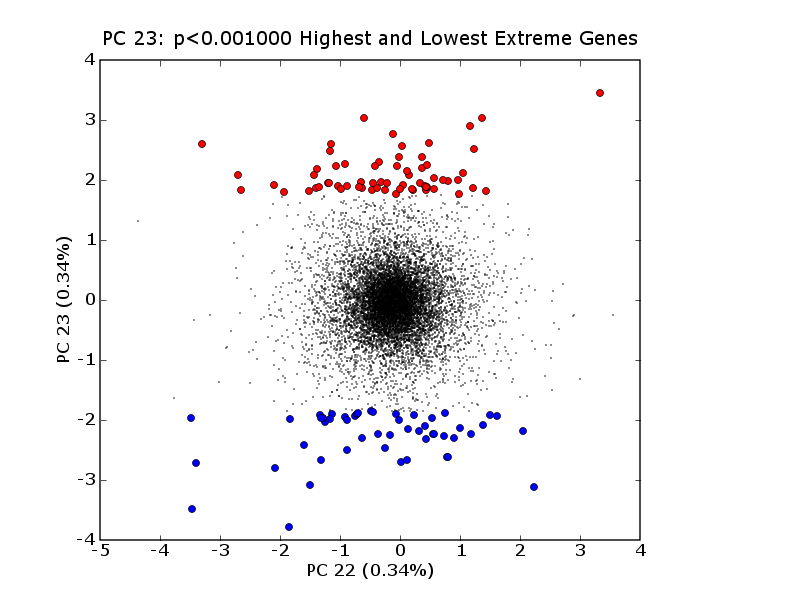
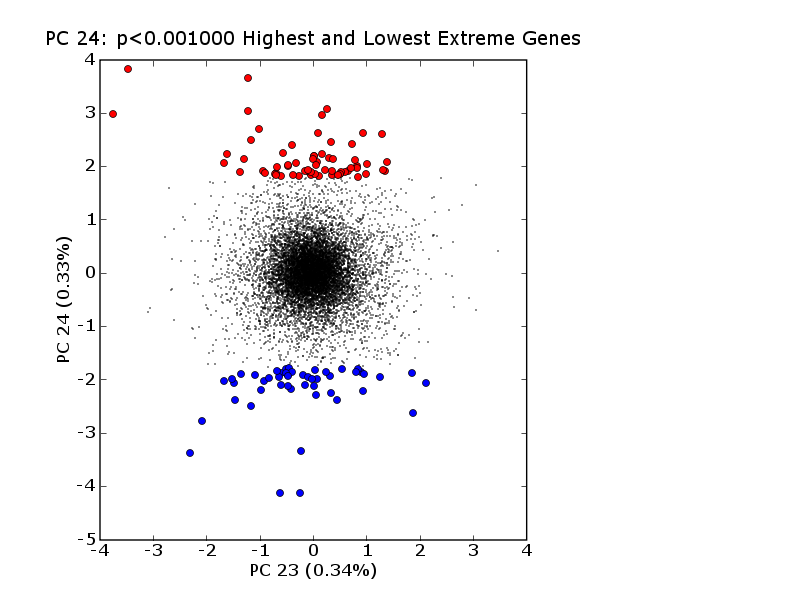
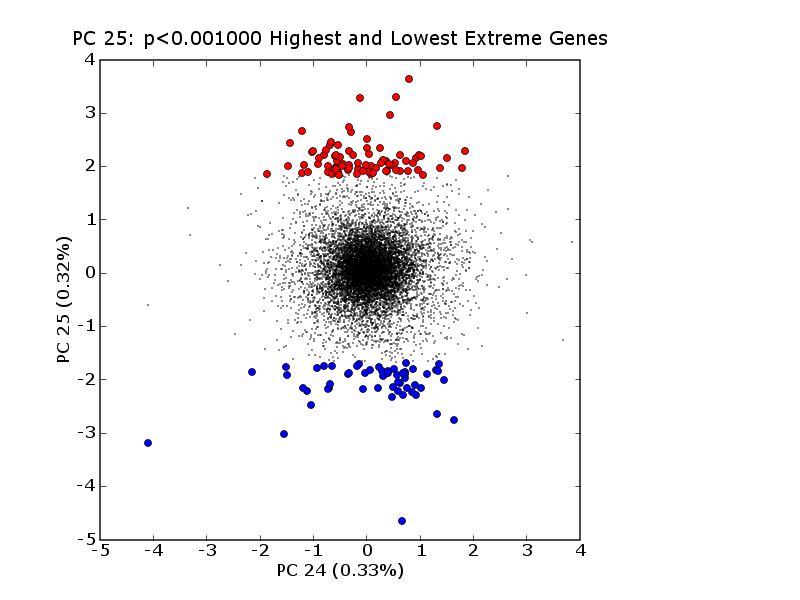
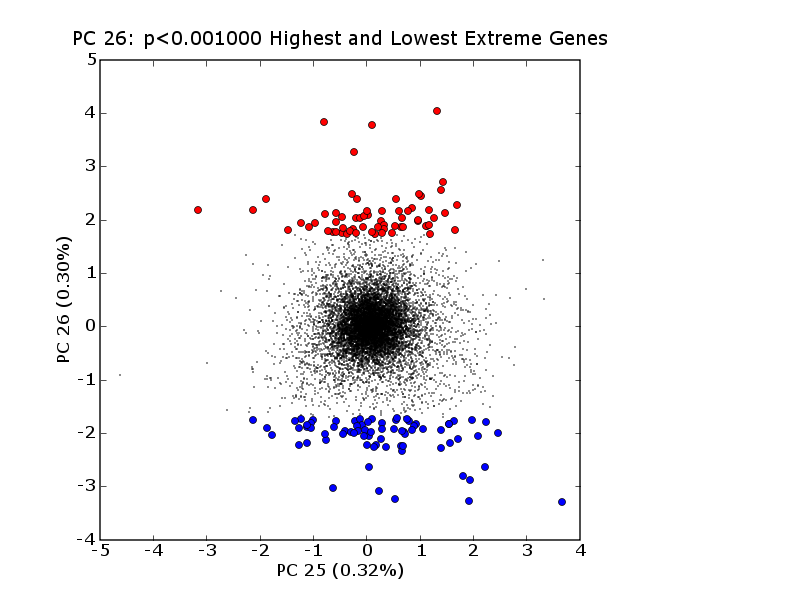
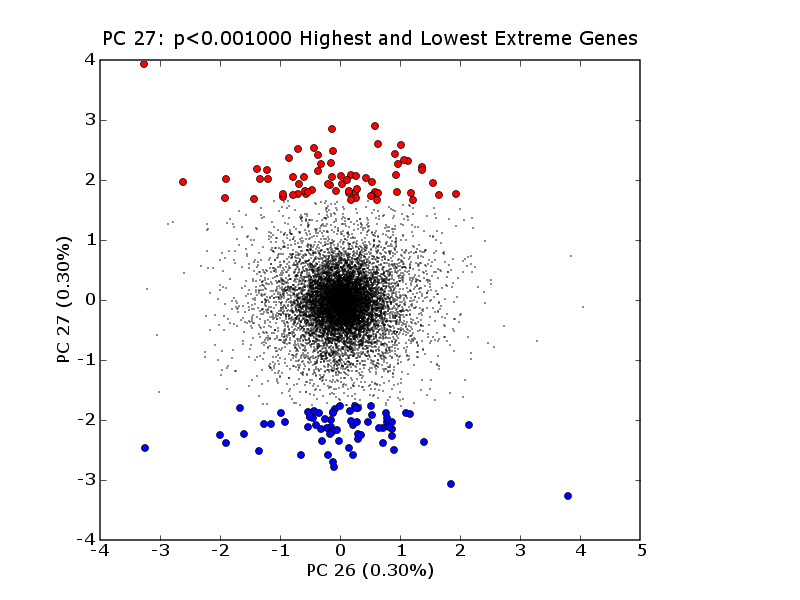
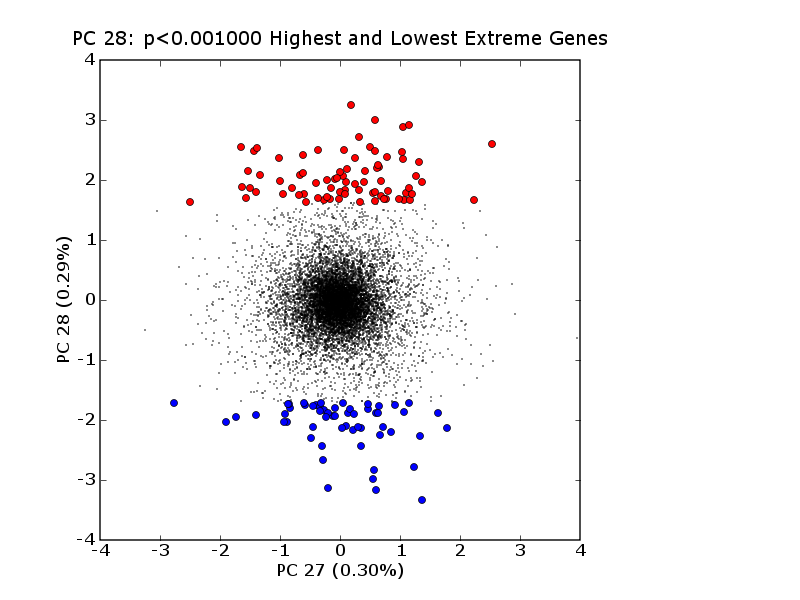
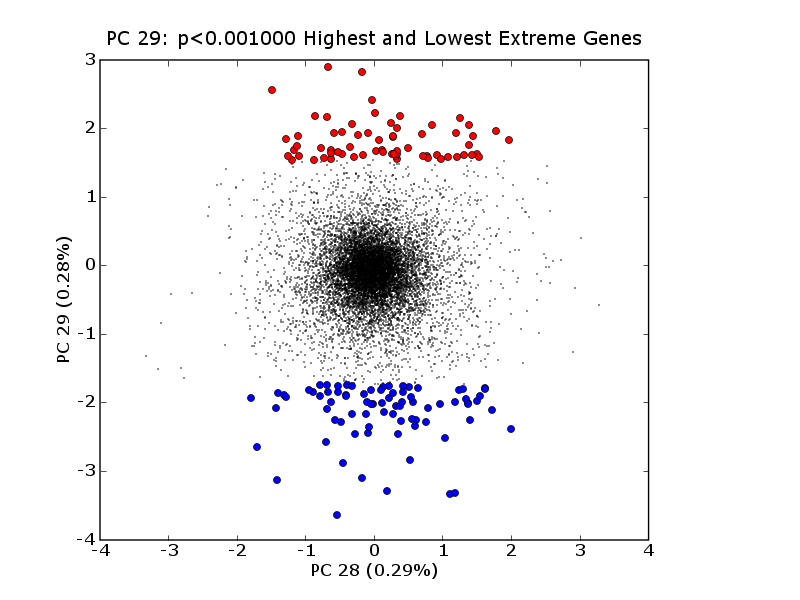
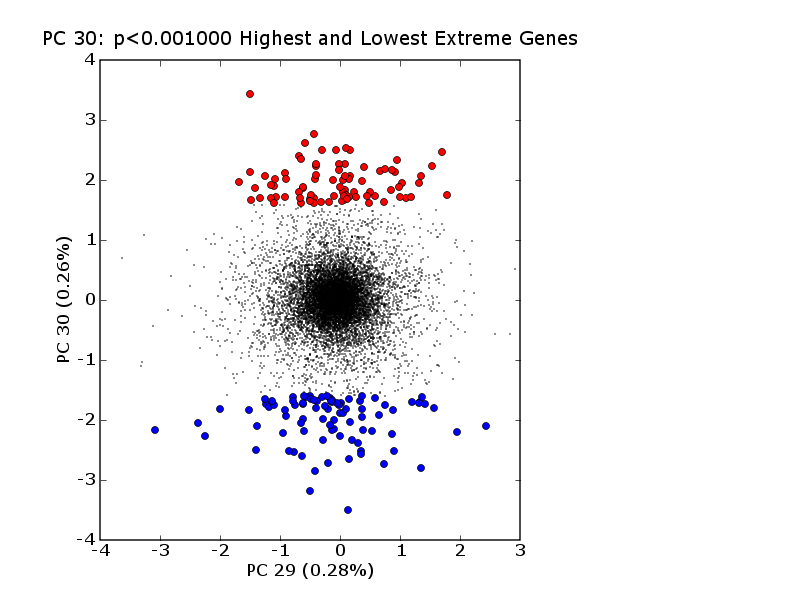
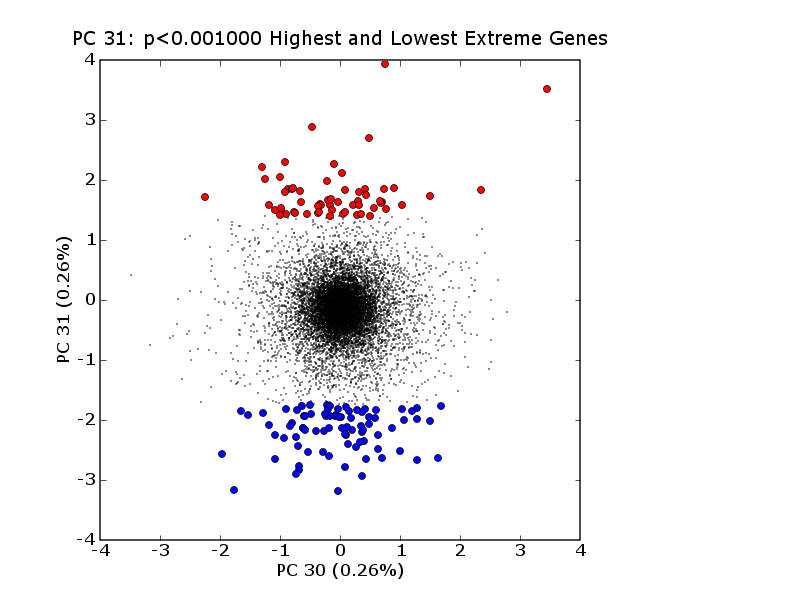
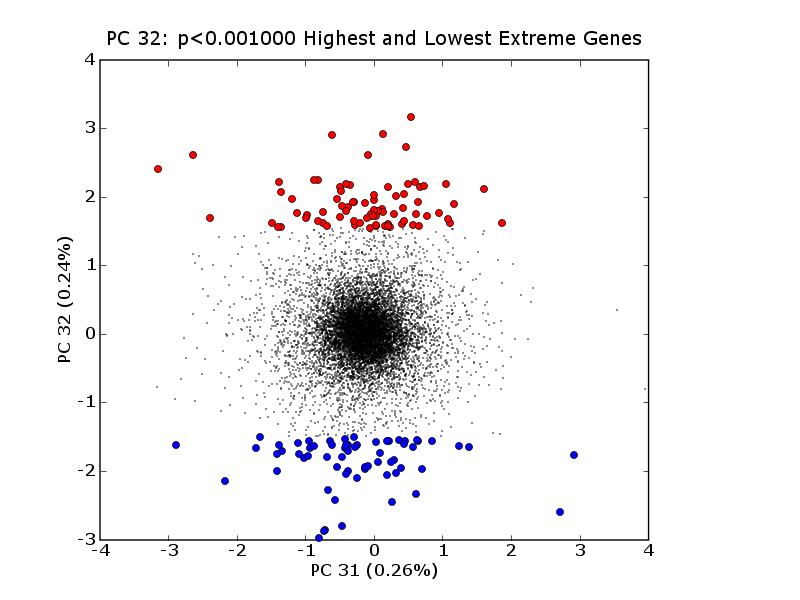
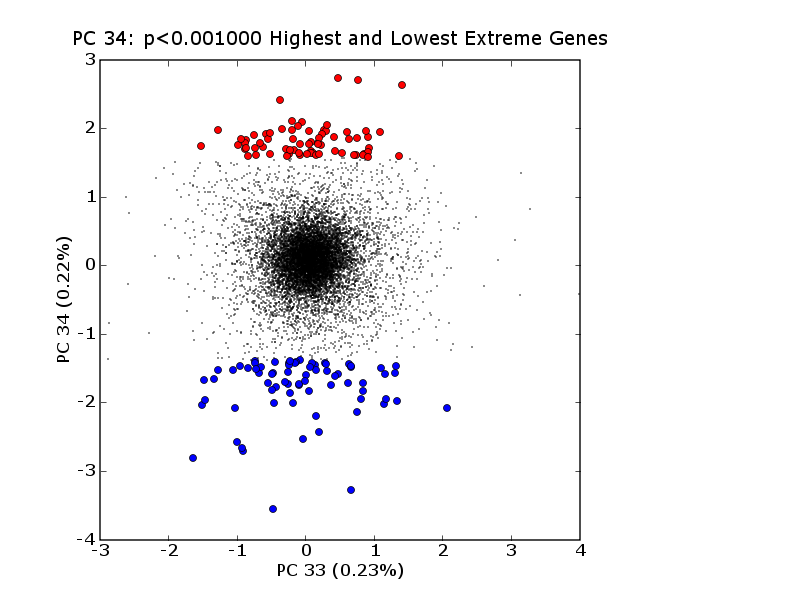
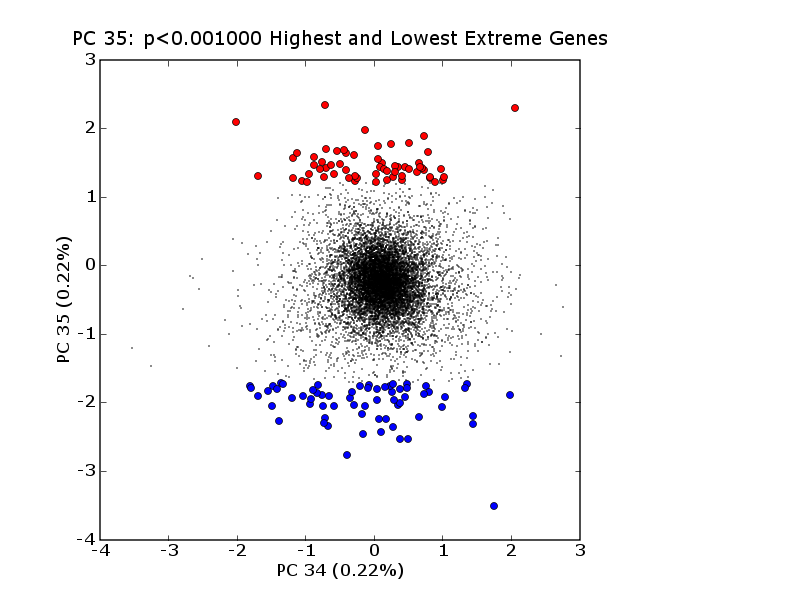
| pcNN-outliers.png | Scatter plot of probe expression levels projected onto PCn-1 vs PCn space with high PCEG set in red and low PCEG set in blue. |
| pcNN-condition-groups.txt | Tab-delimited text file listing the conditions (samples) that are up, flat and down for pcNN, ordered by decreasing difference of means, including a few selected covariates: Patient_# and Status. (The full set covariate values are available in the CompClustWeb demo). |
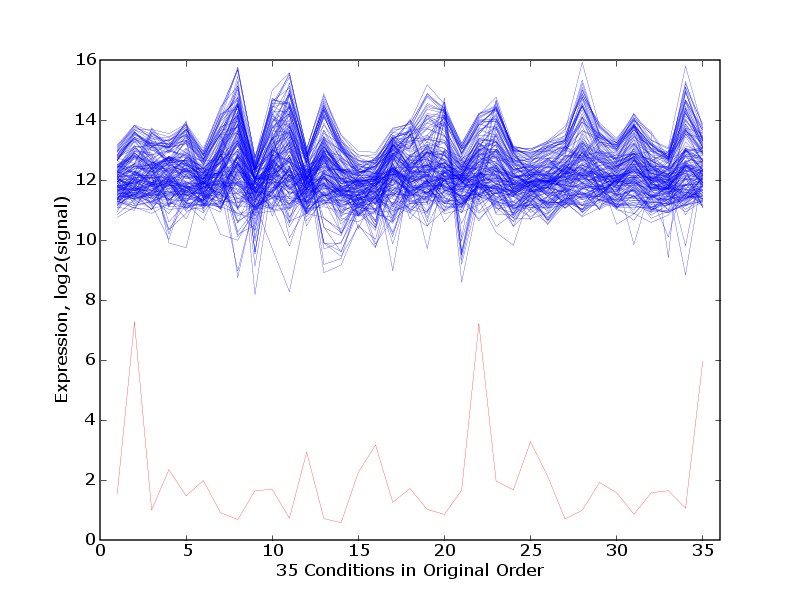
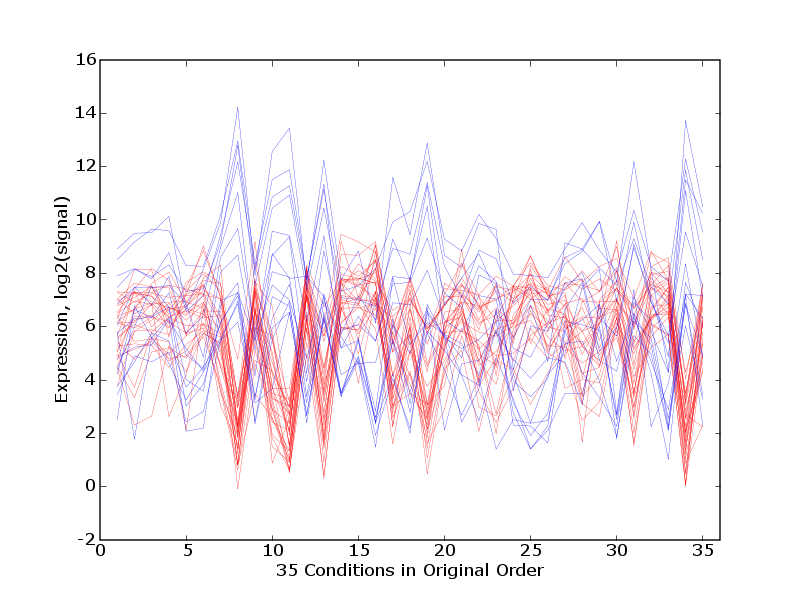
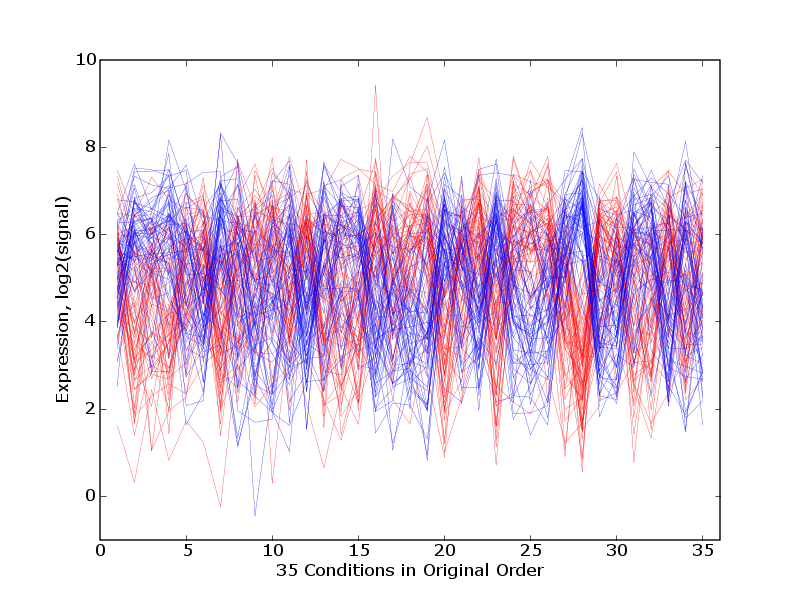
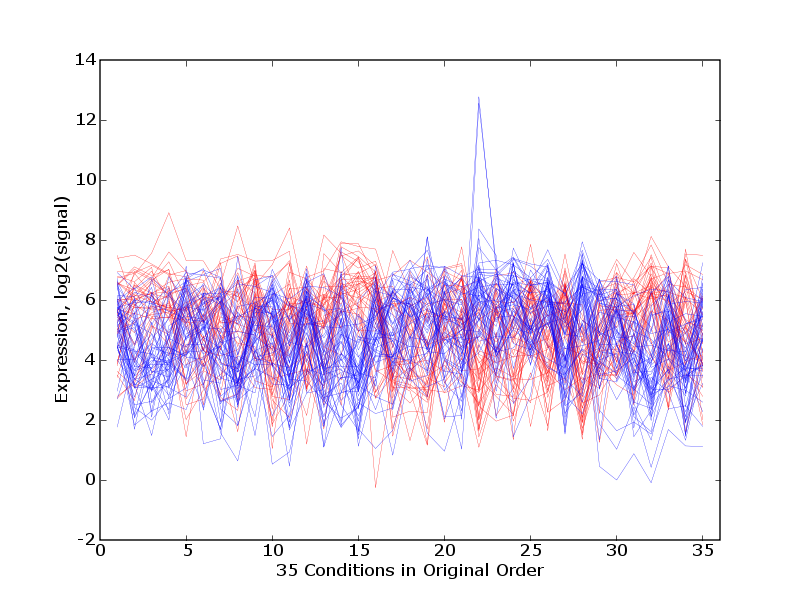
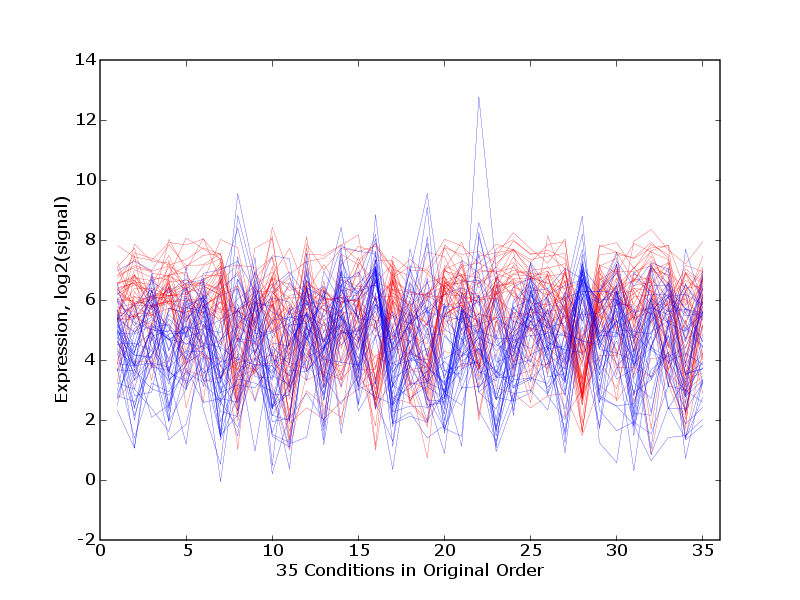
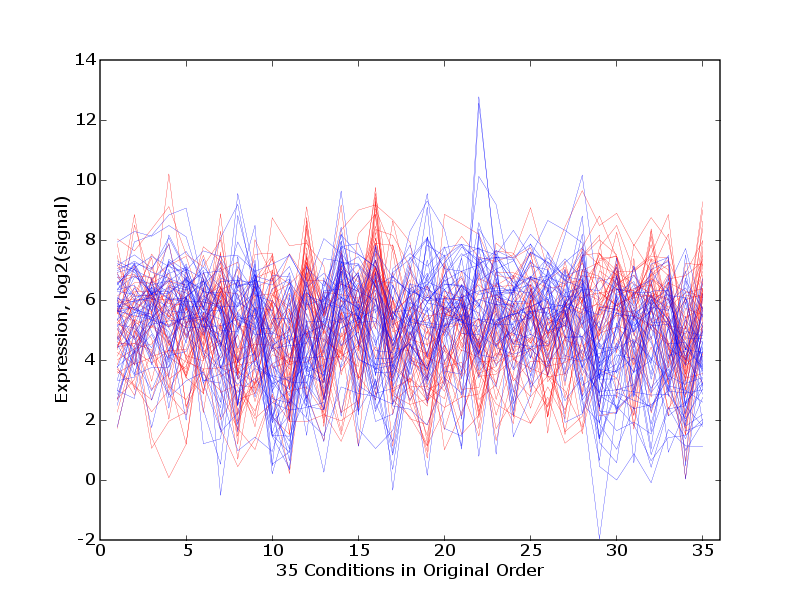
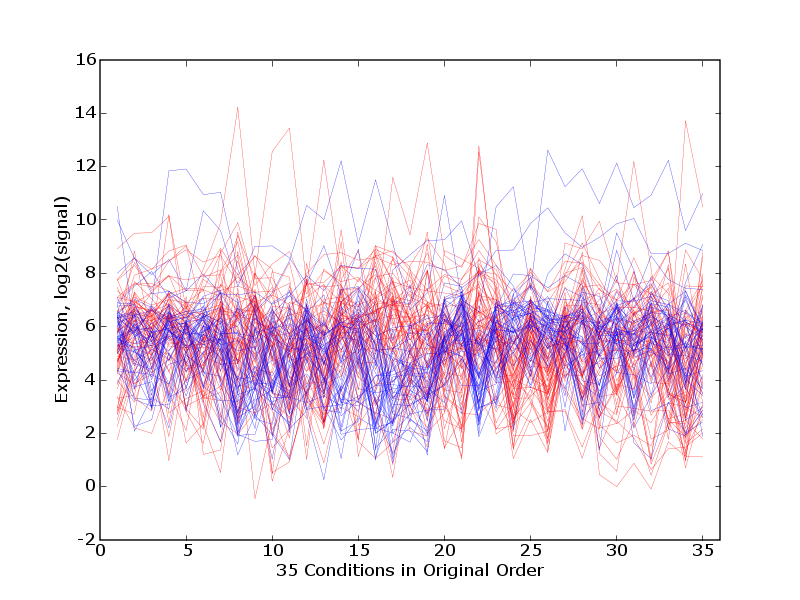
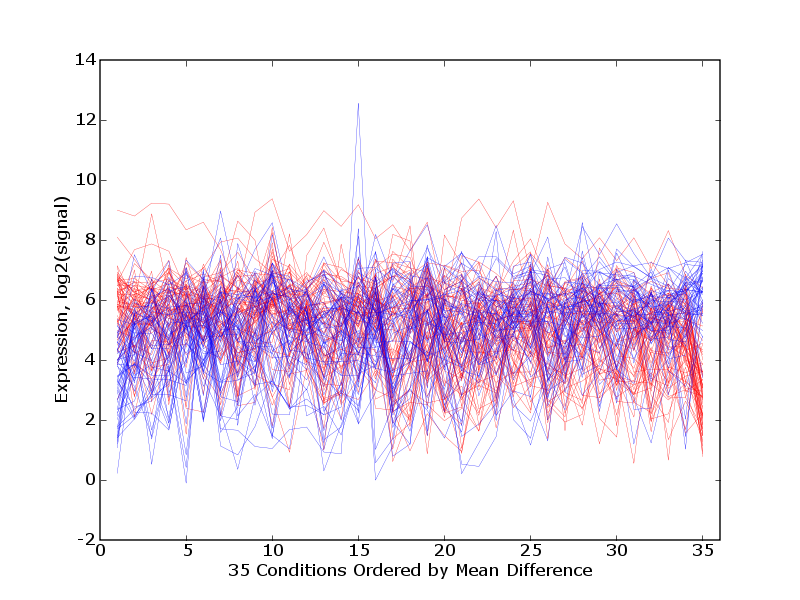
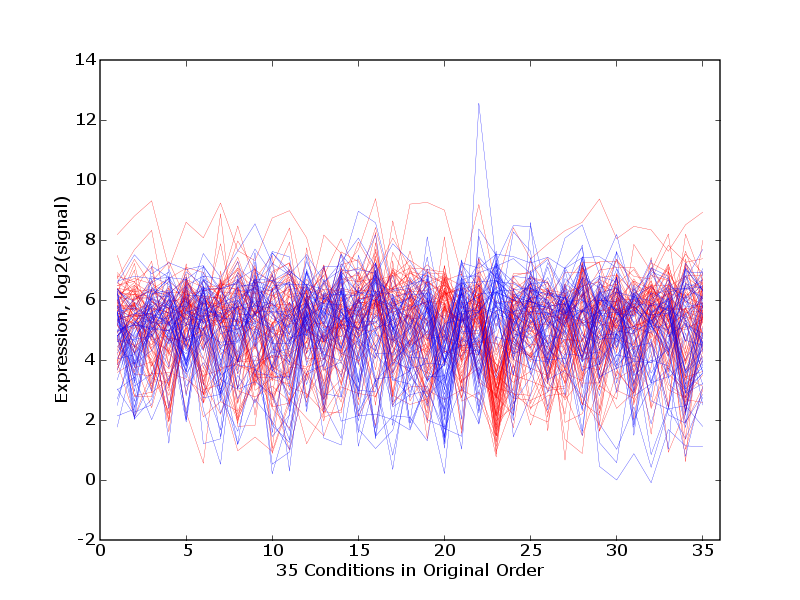
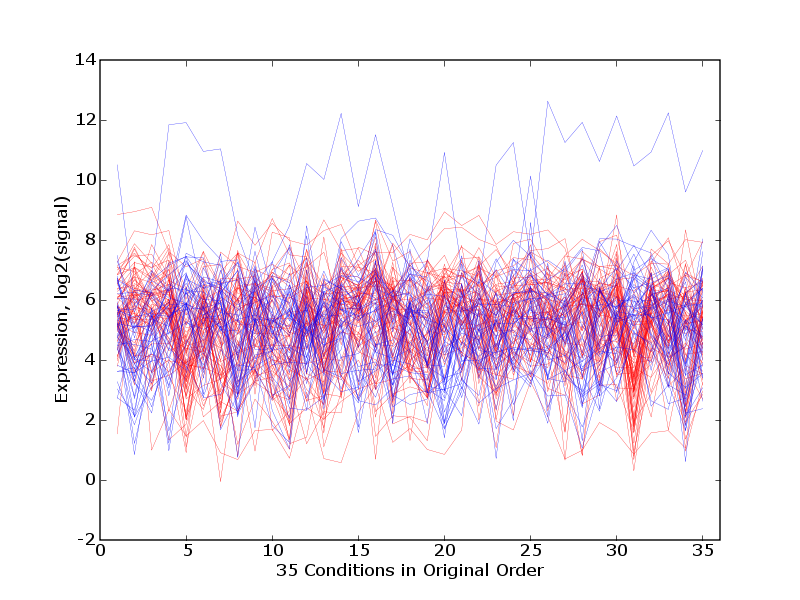
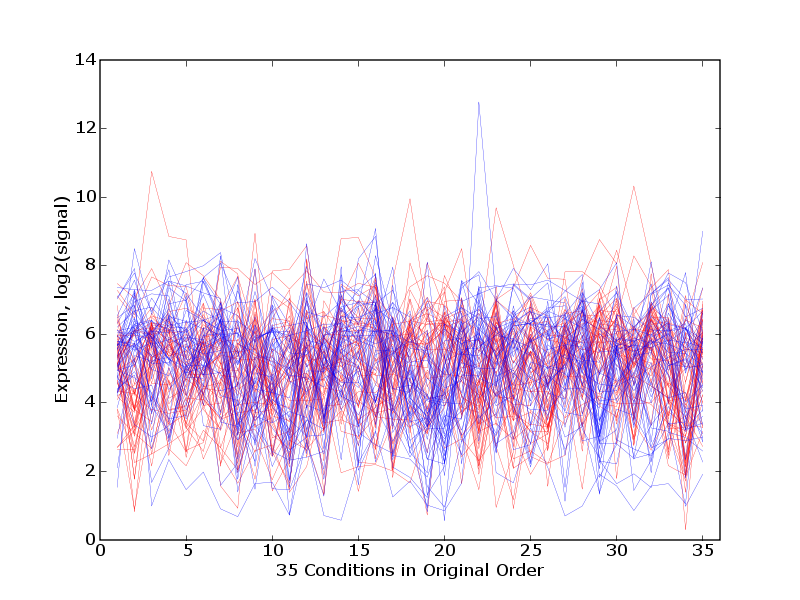
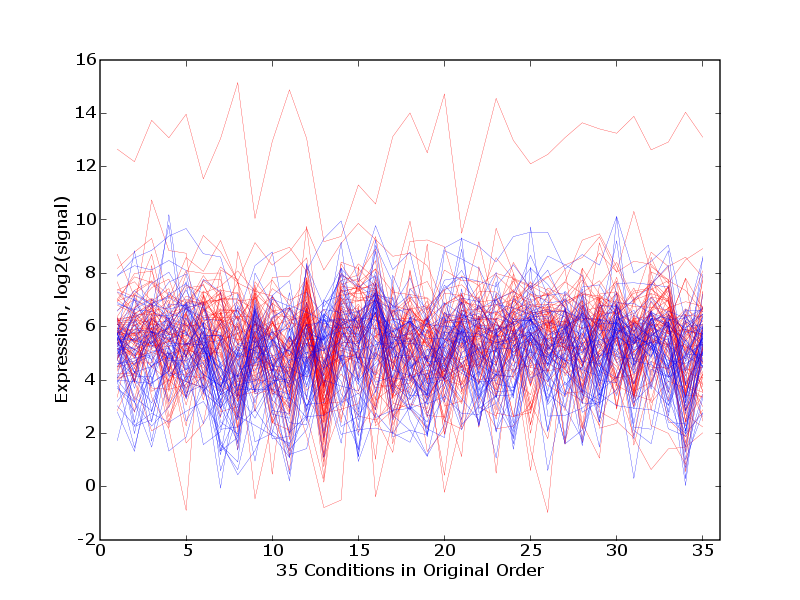
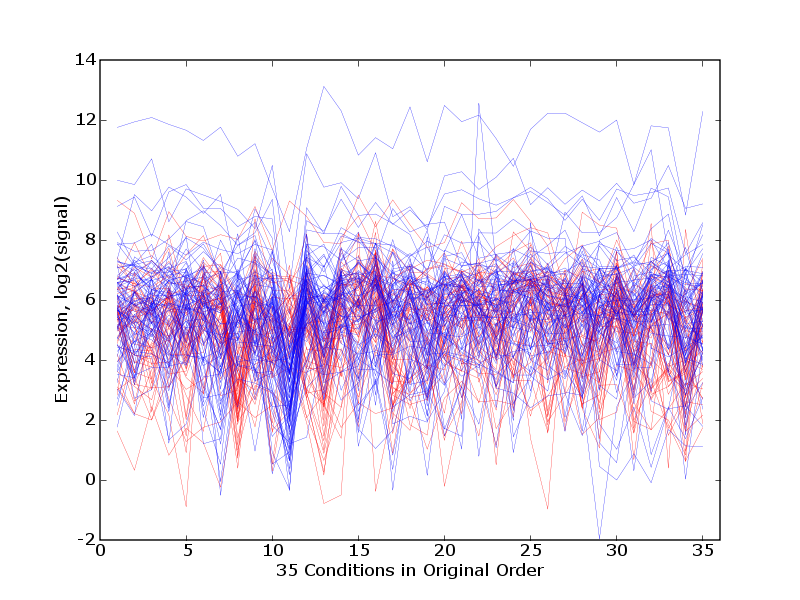
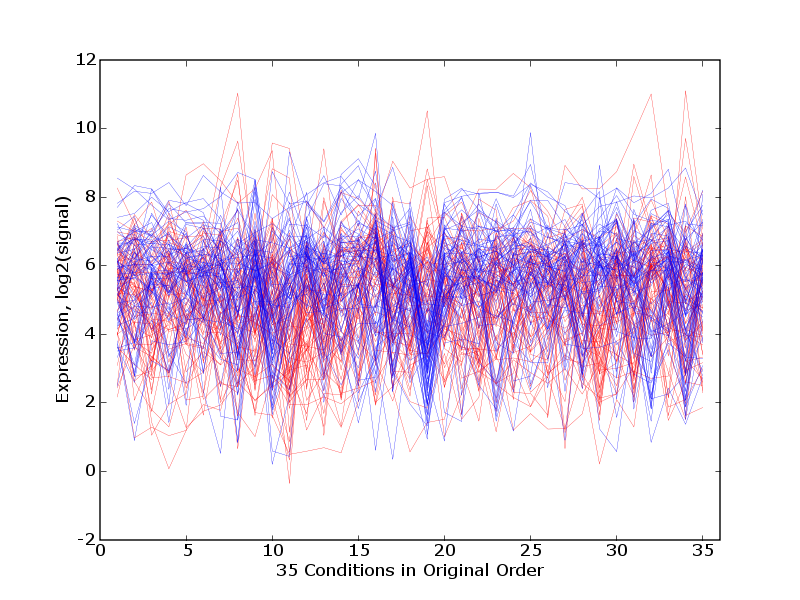
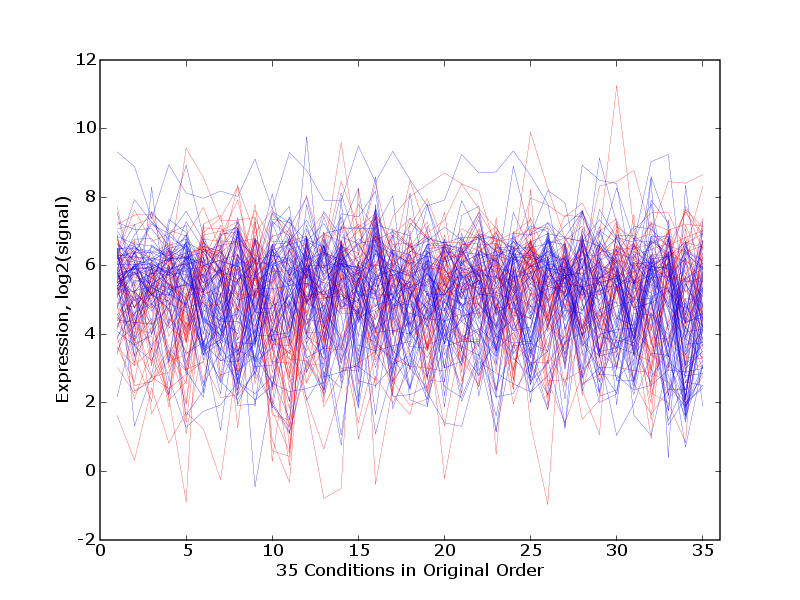
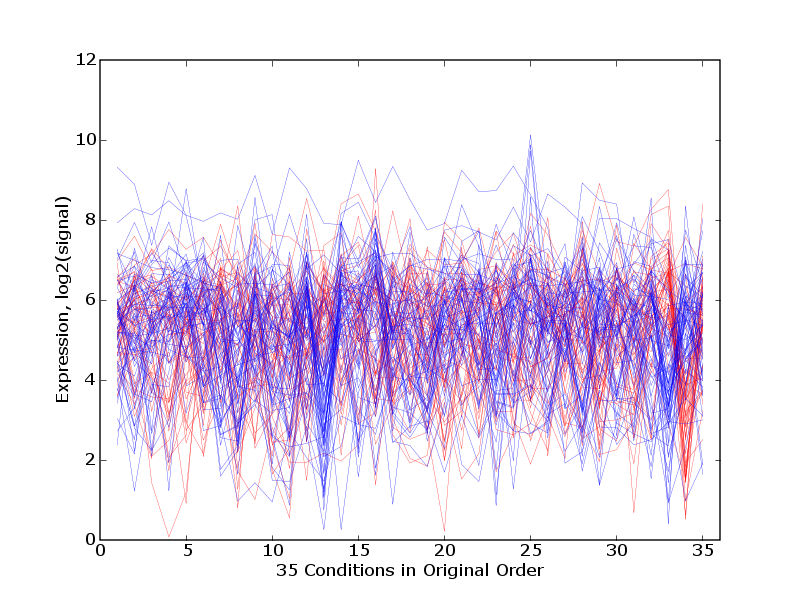
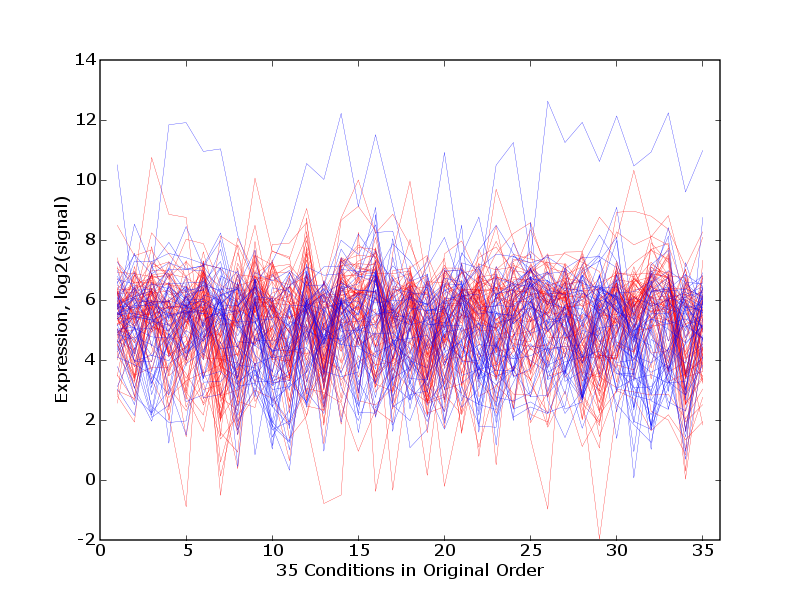
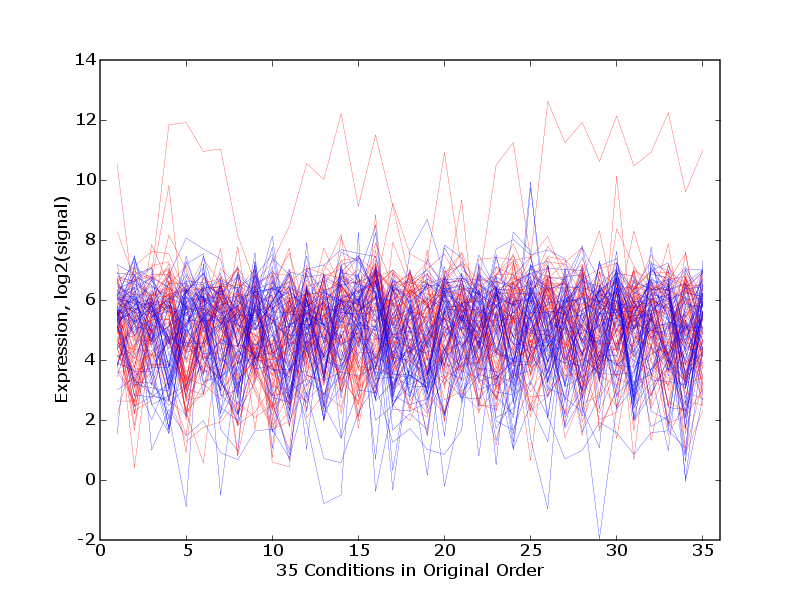
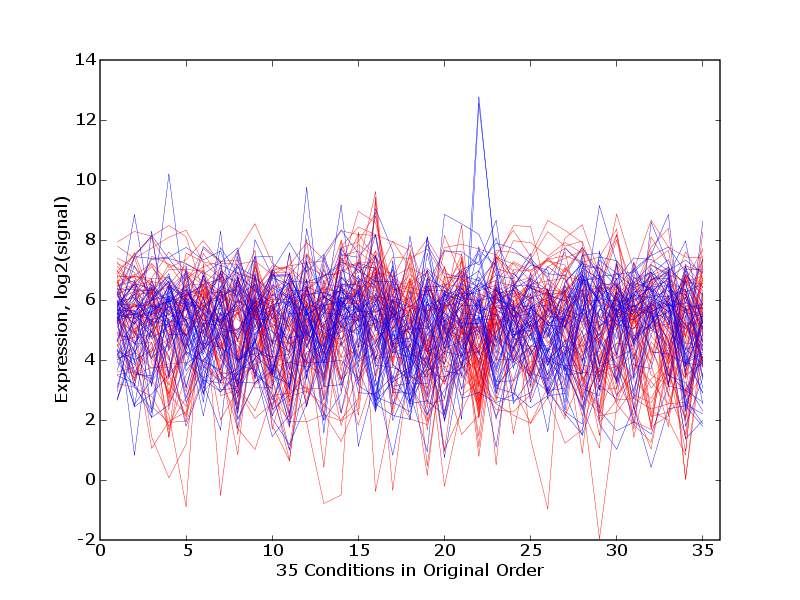
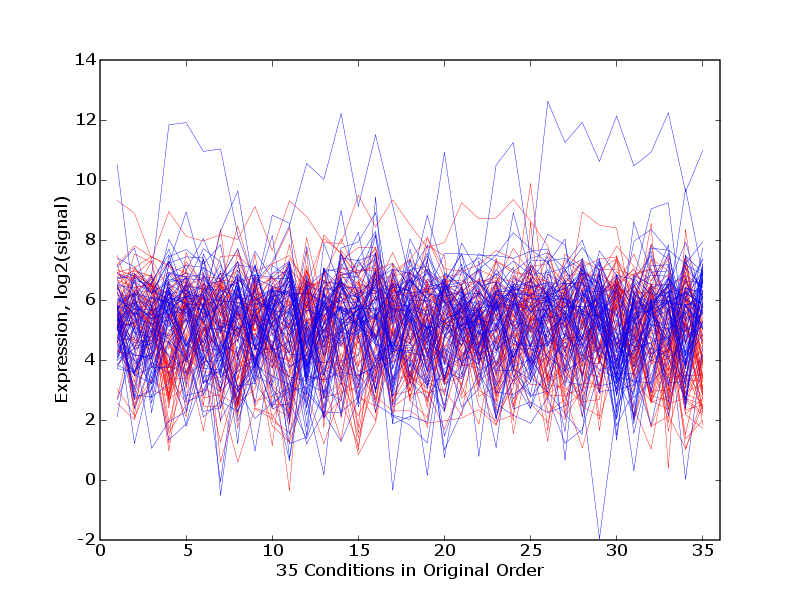
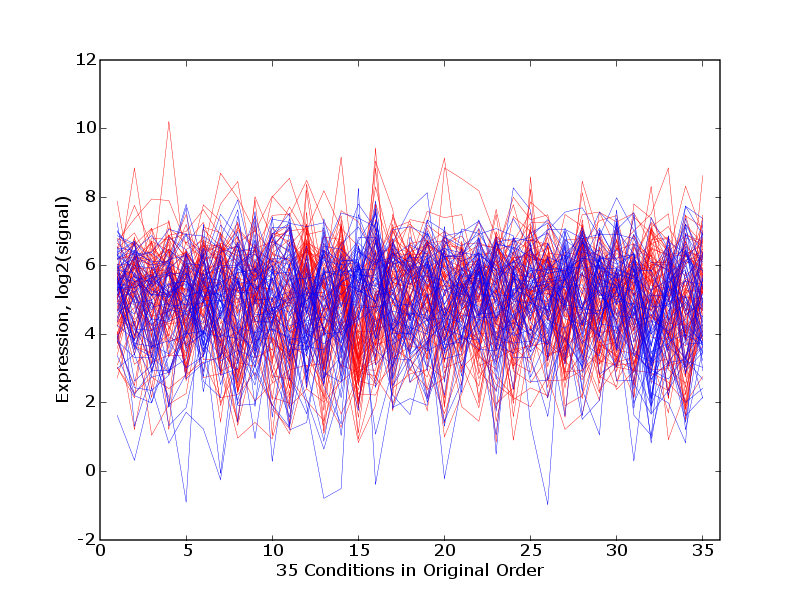
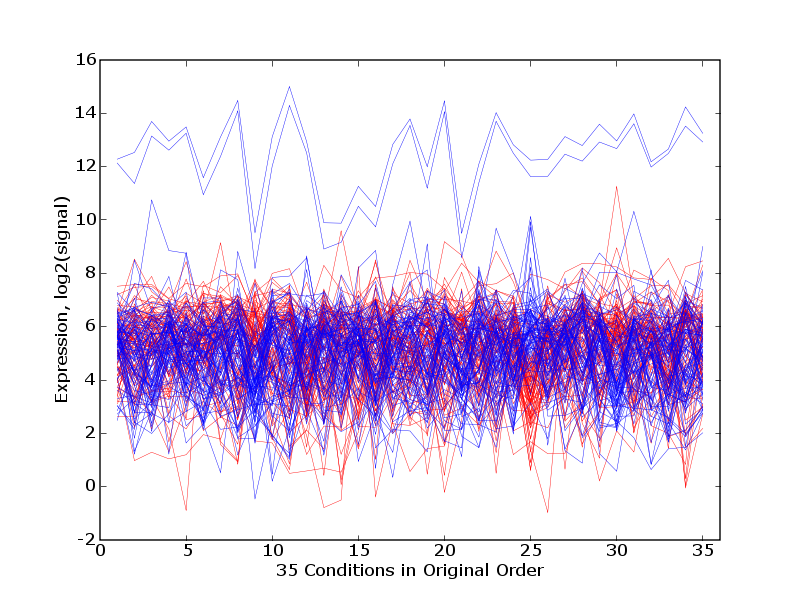
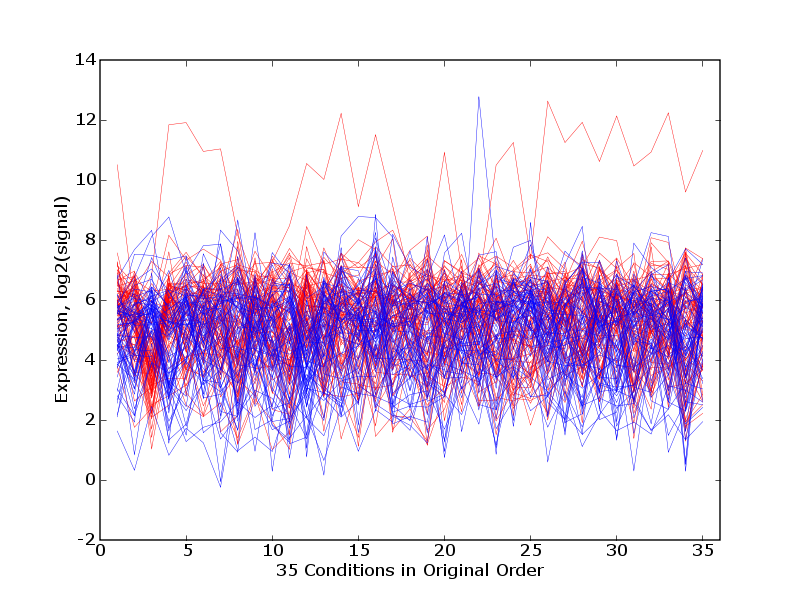
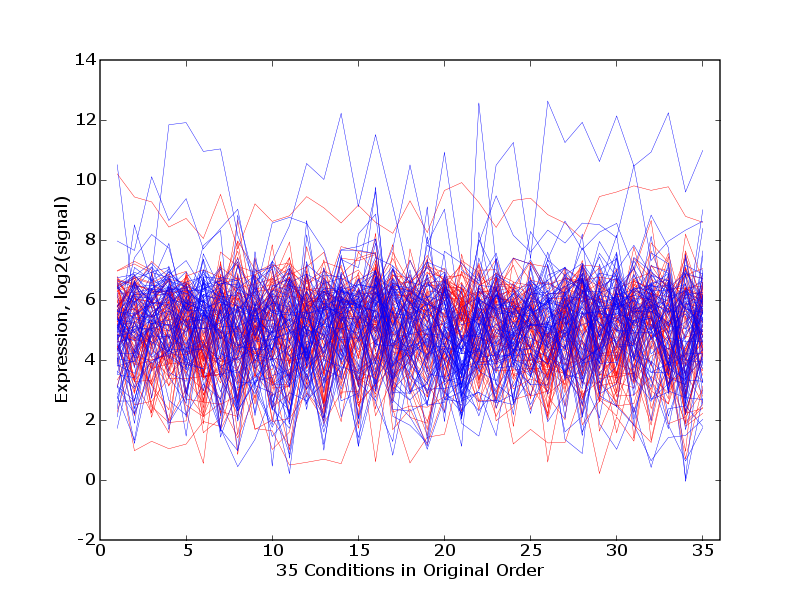
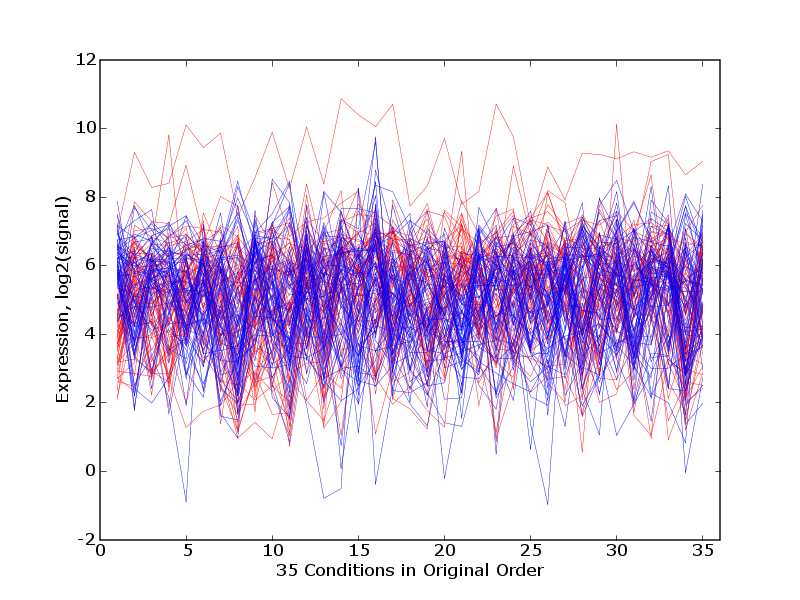
| pcNN-outlier-trajectories-order-original.png | Trajectory plots for the high (red) and low (blue) PCEG sets with tissues in the order in which the original data were provided. |
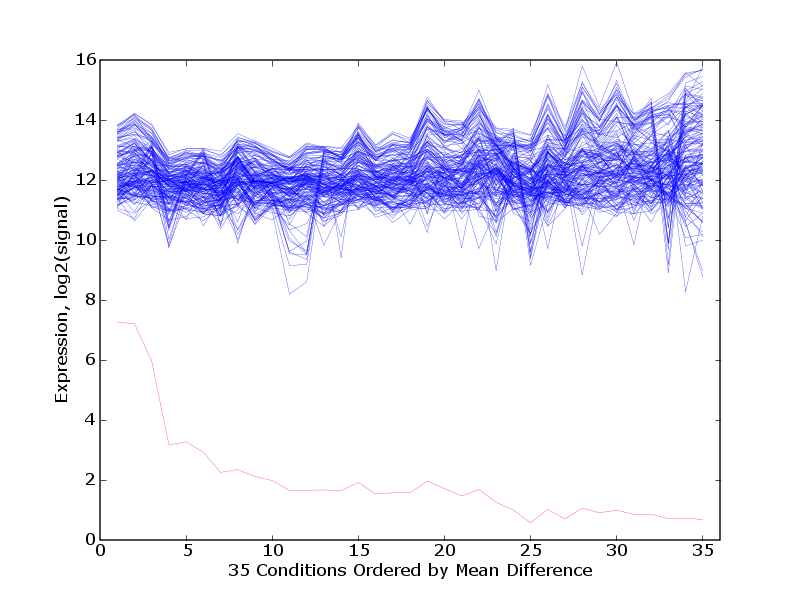
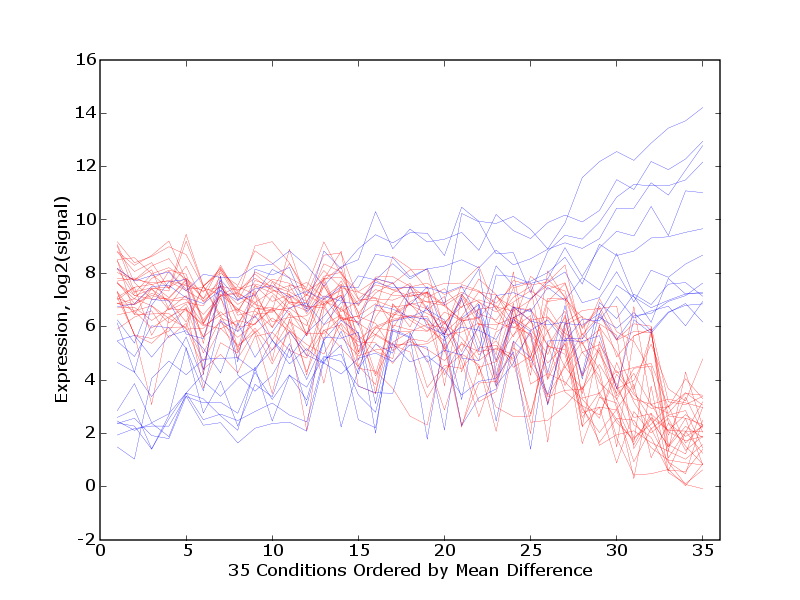
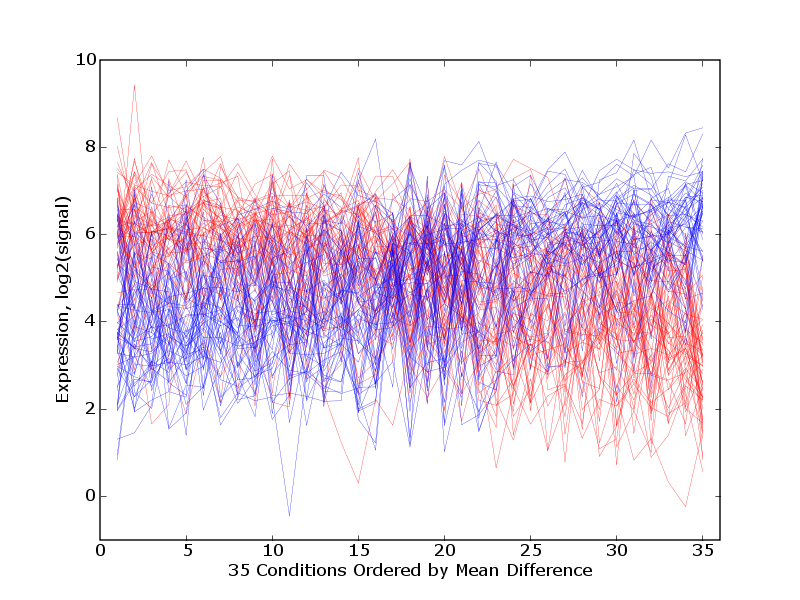
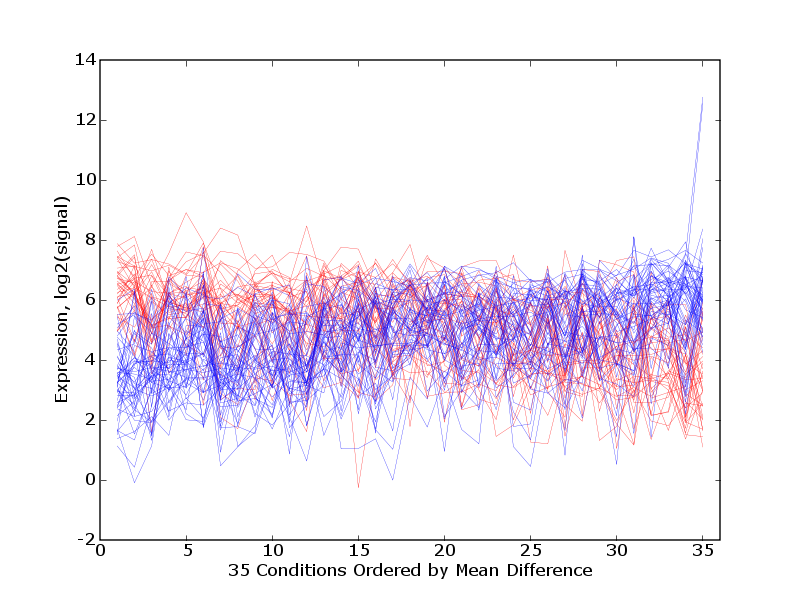
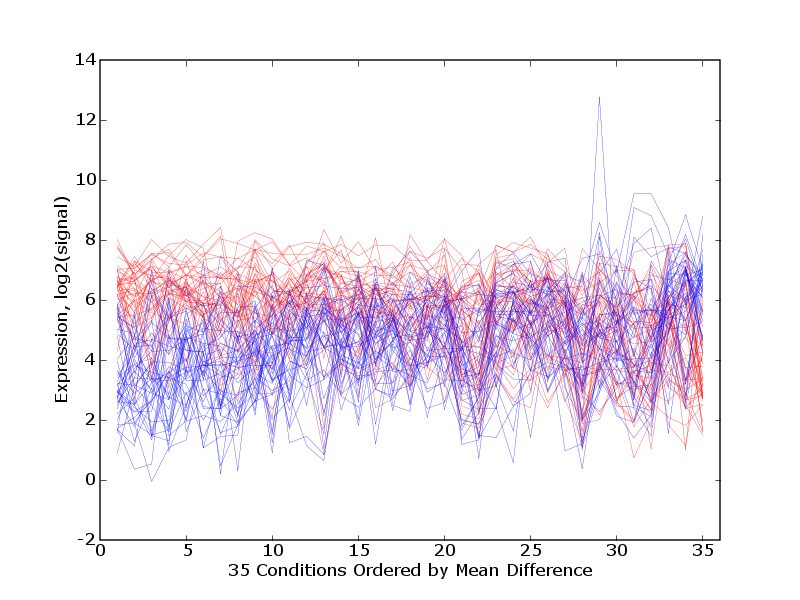
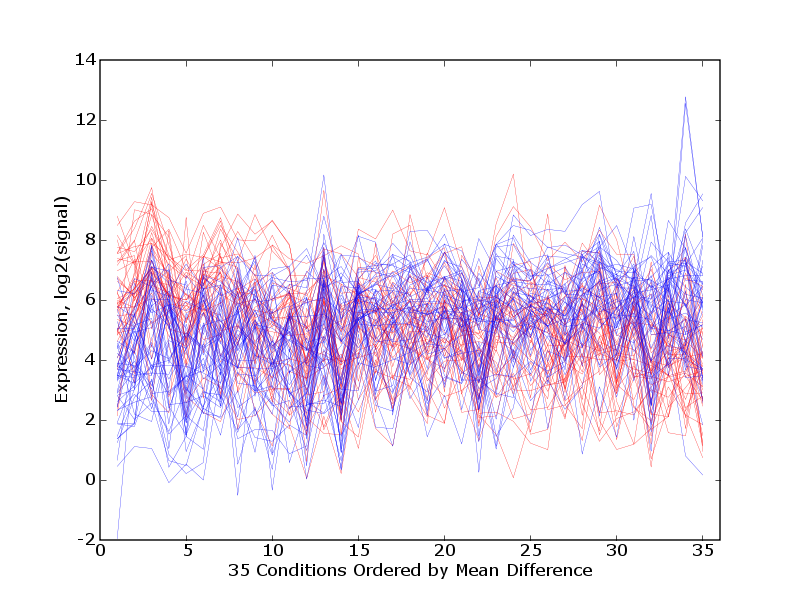
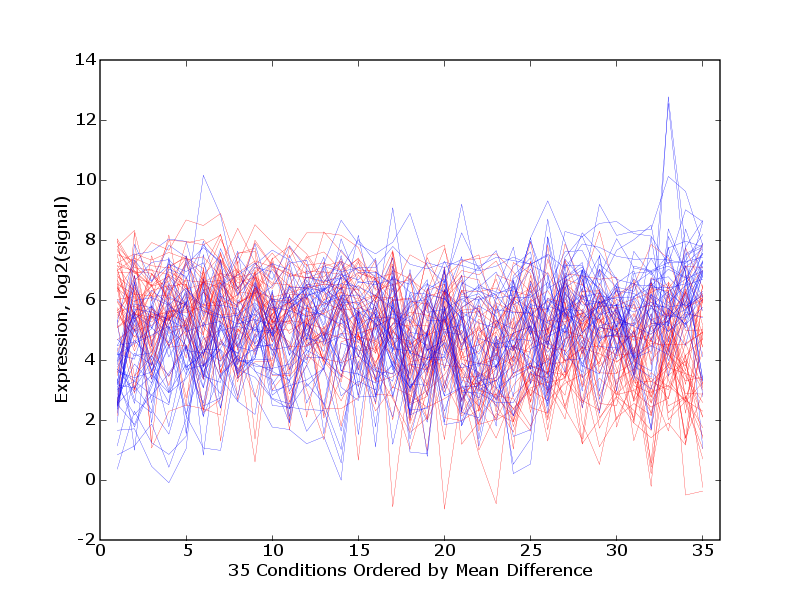
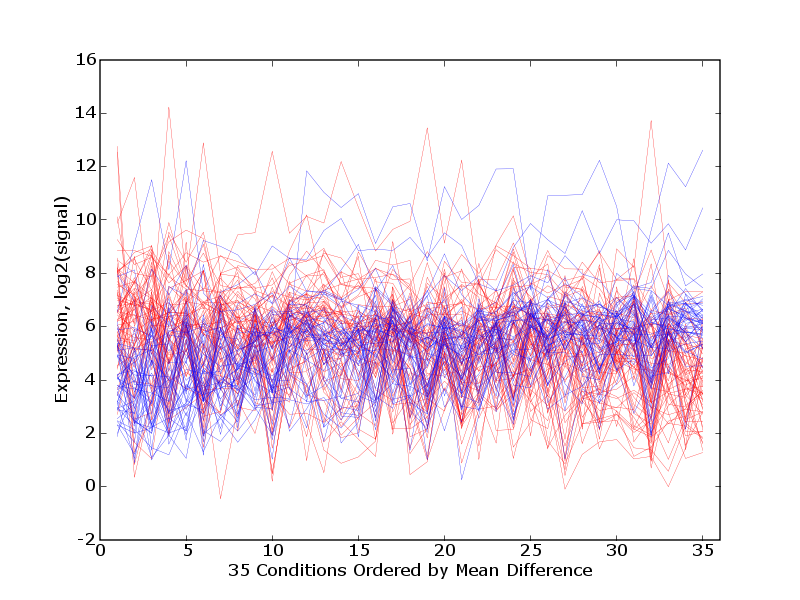
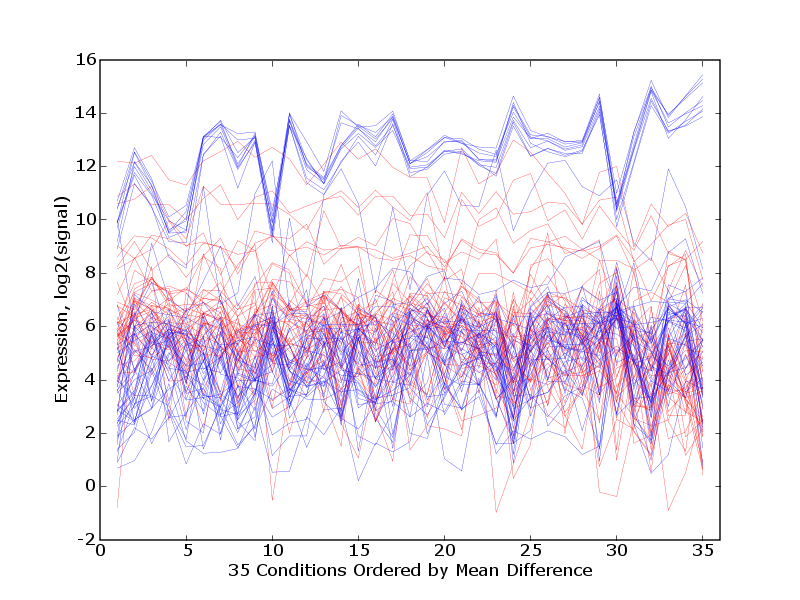
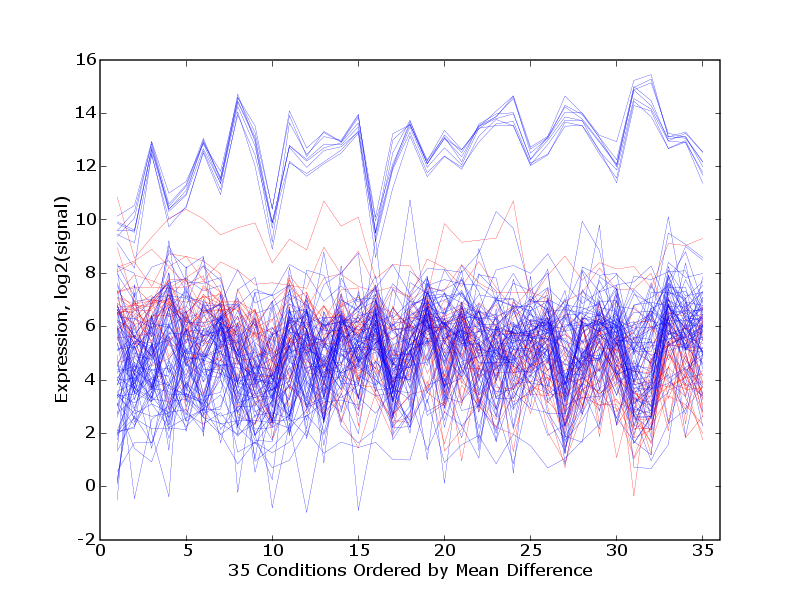
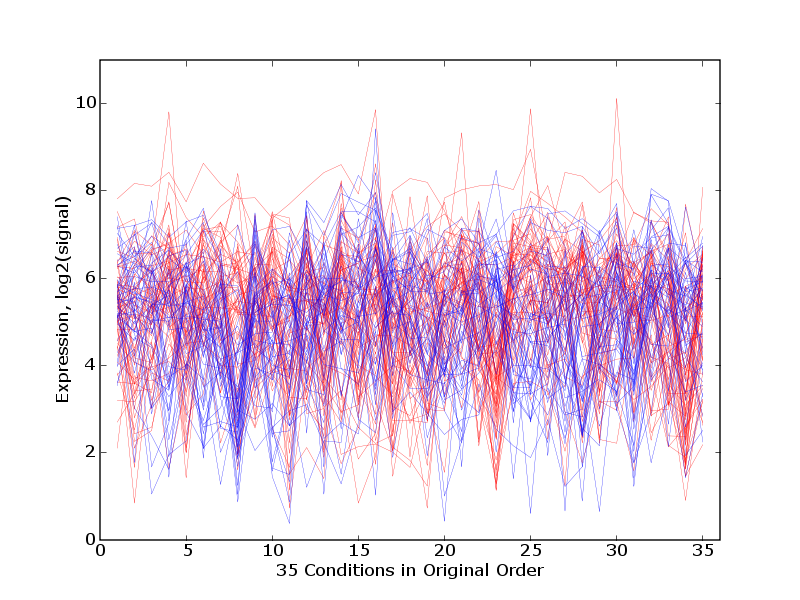
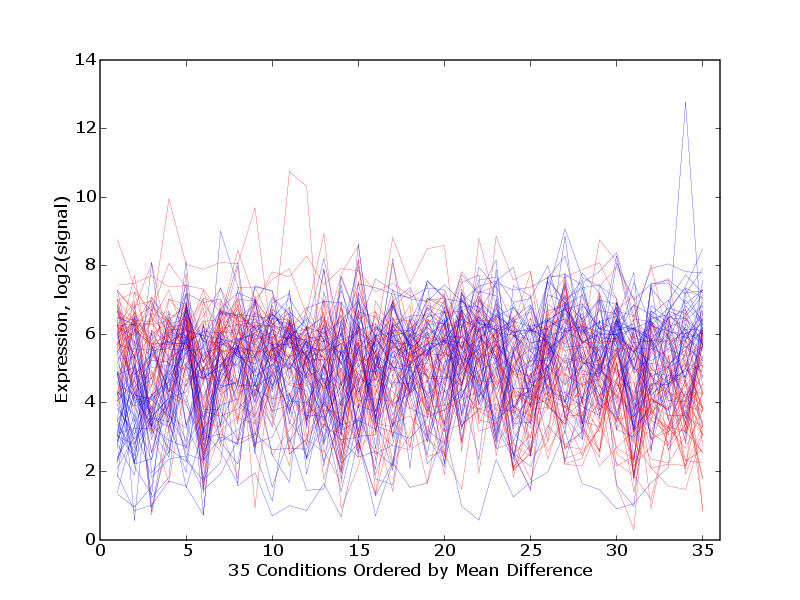
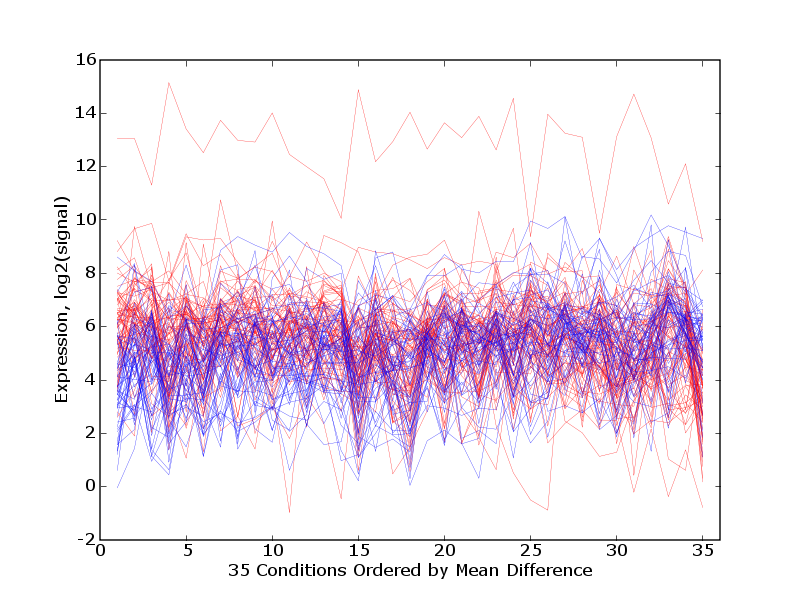
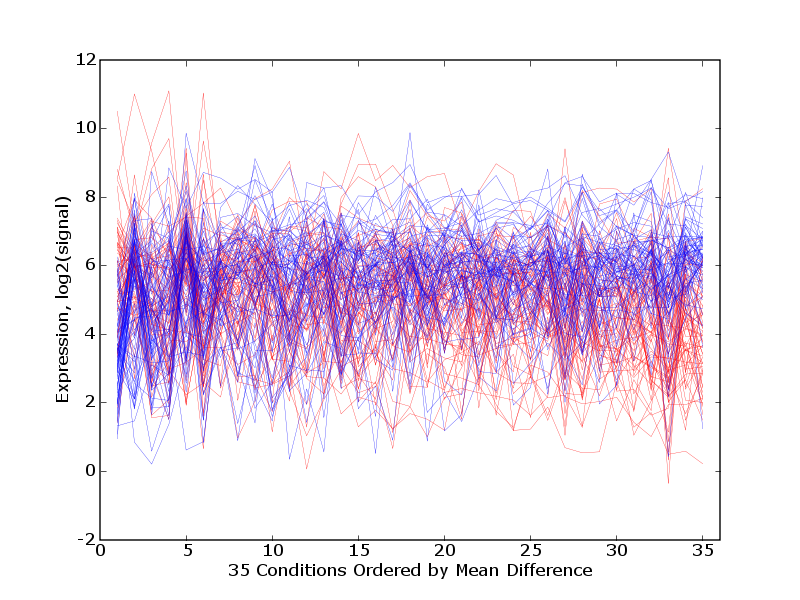
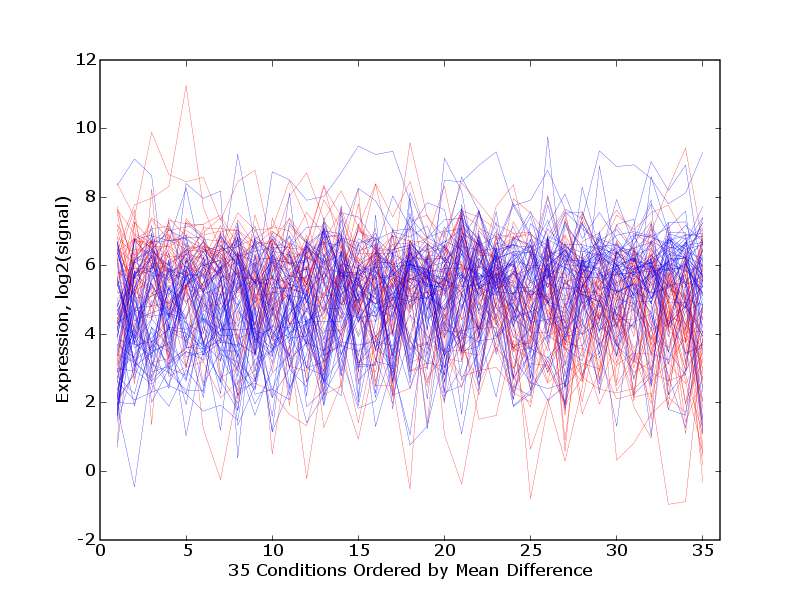
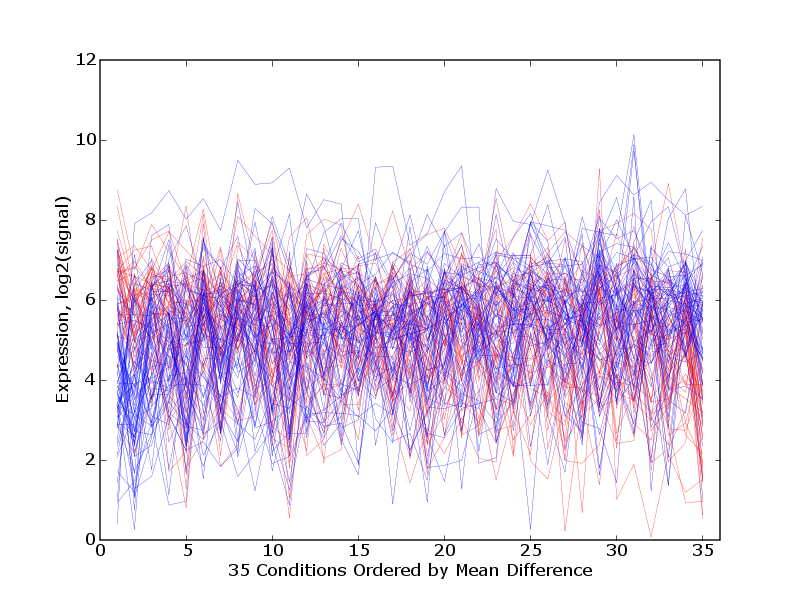
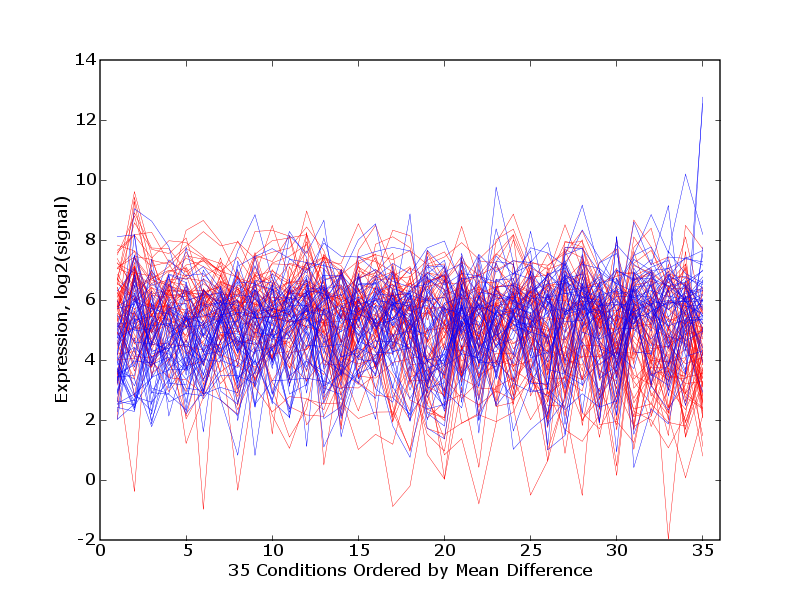
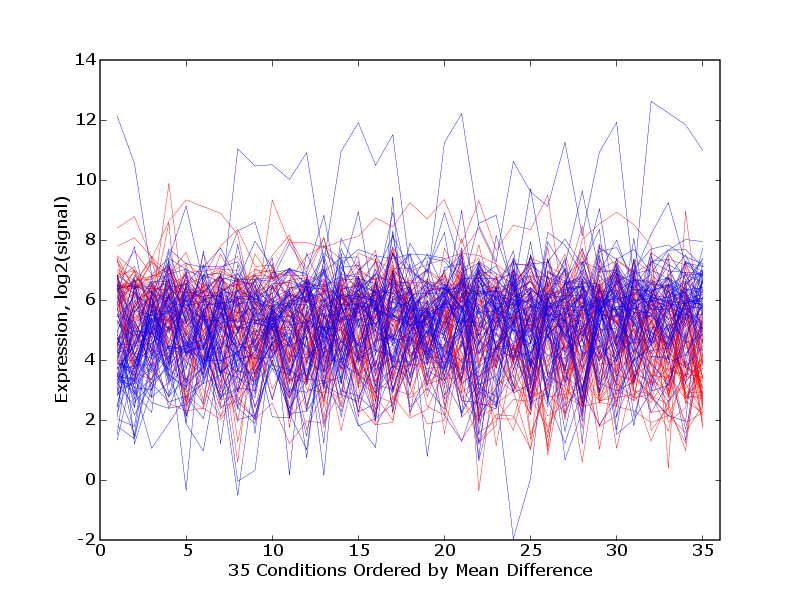
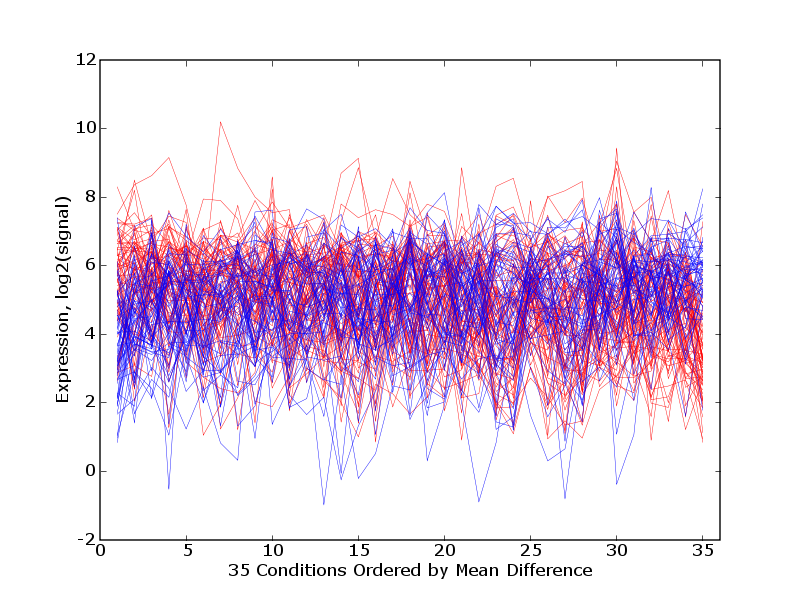
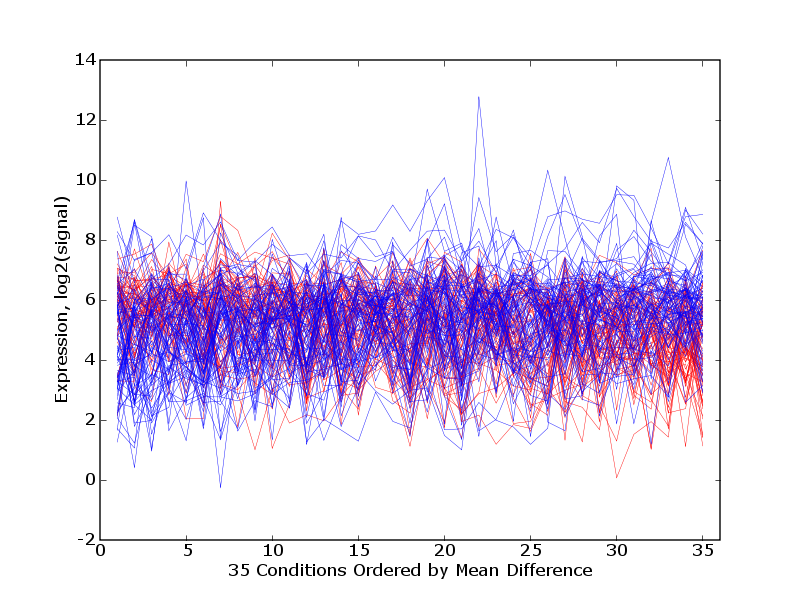
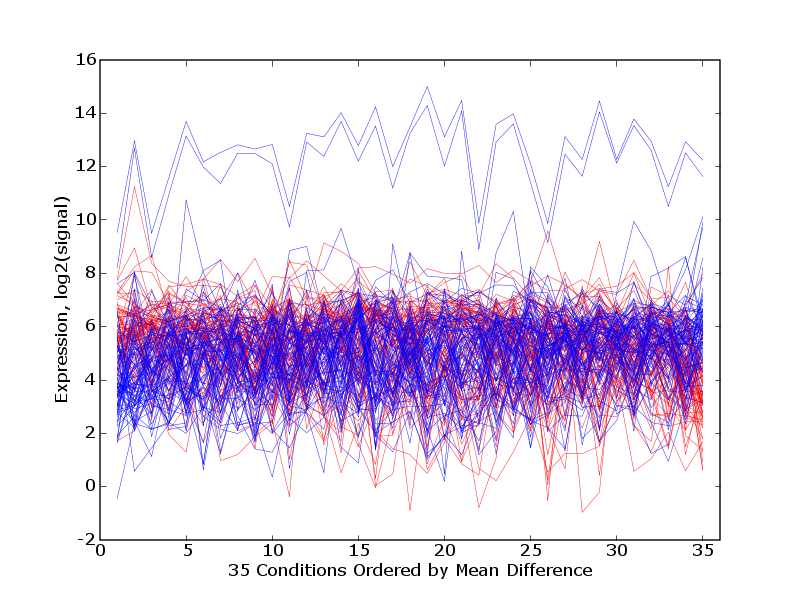
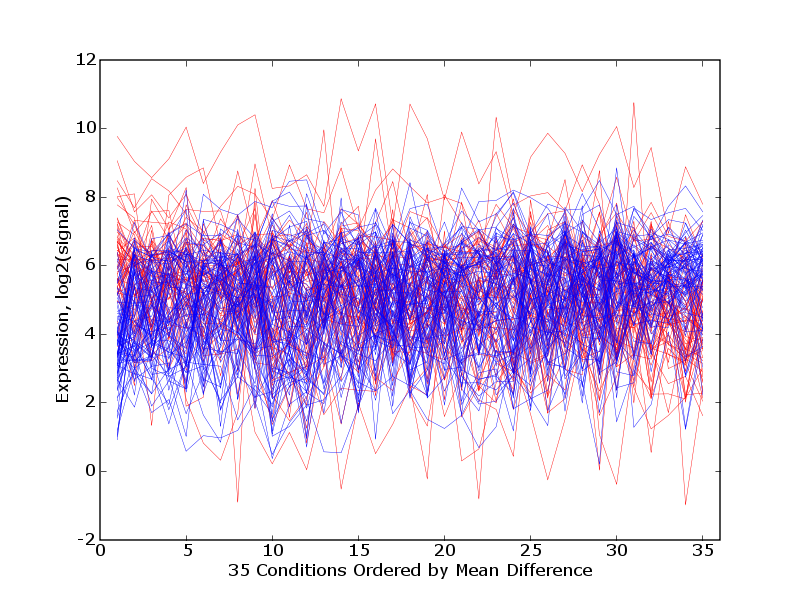
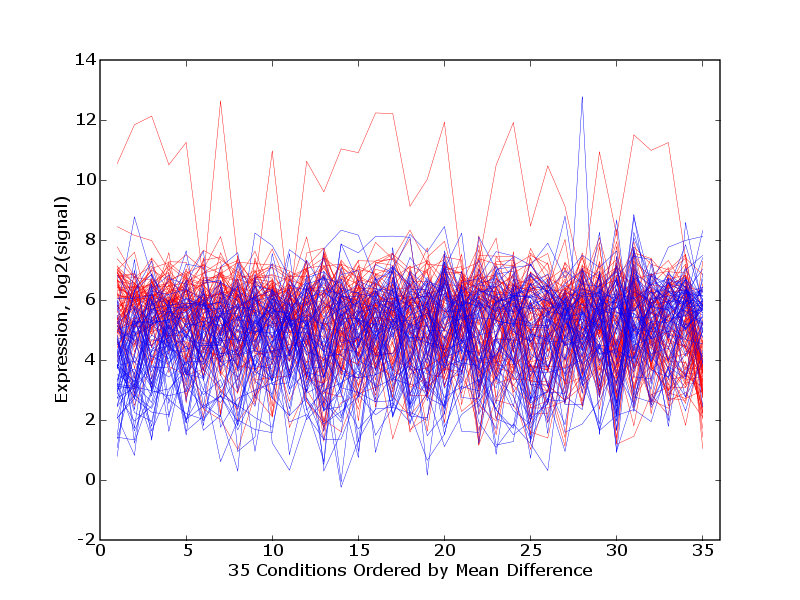
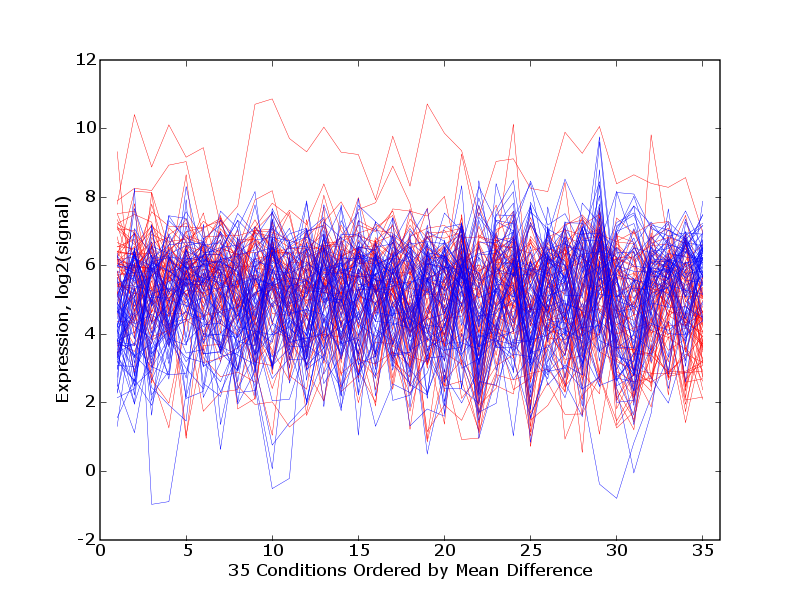
| pcNN-outlier-trajectories-order-meandiff.png | Trajectory plots for high (red) and low (blue) PCEG sets with tissues ordered by decreasing mean differences, and thus grouped by significance (up group at left, flat group in middle and low group at right). |