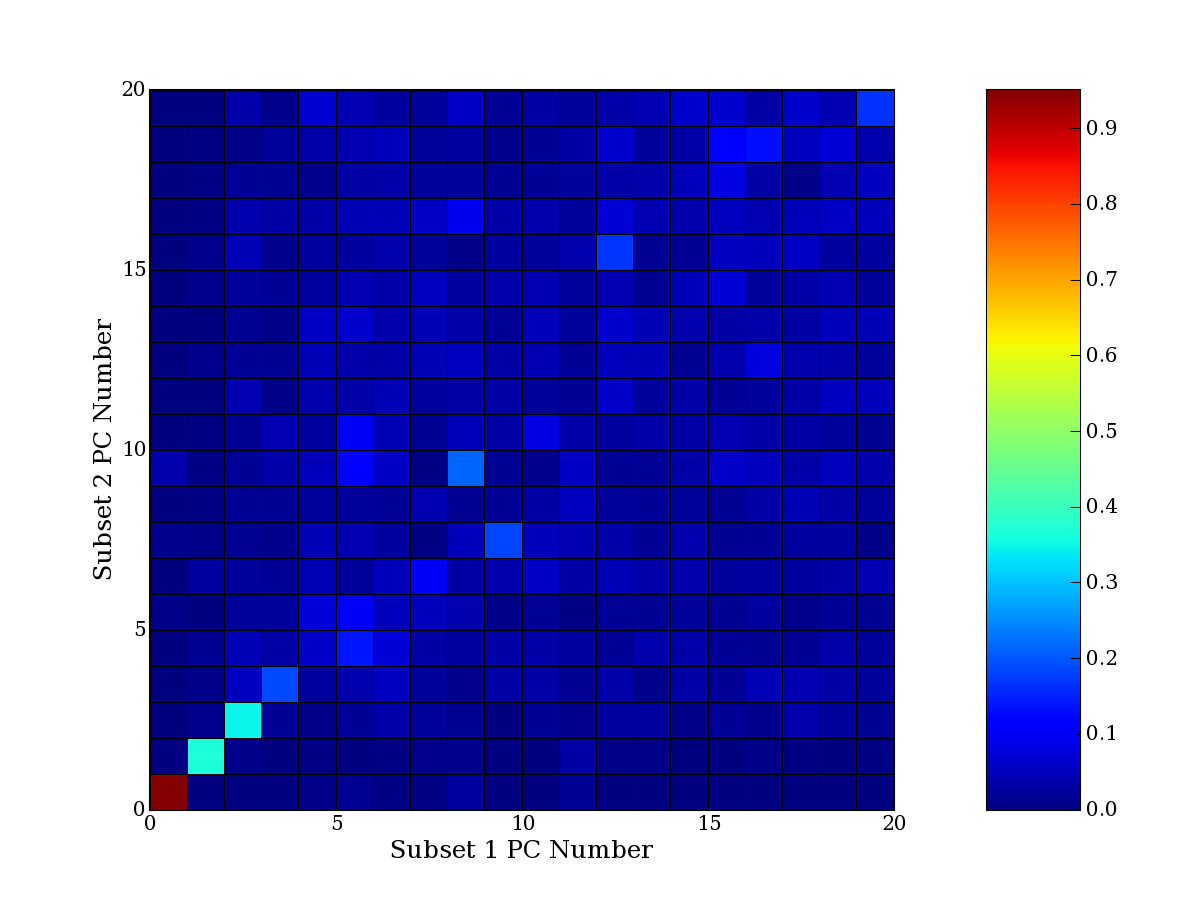
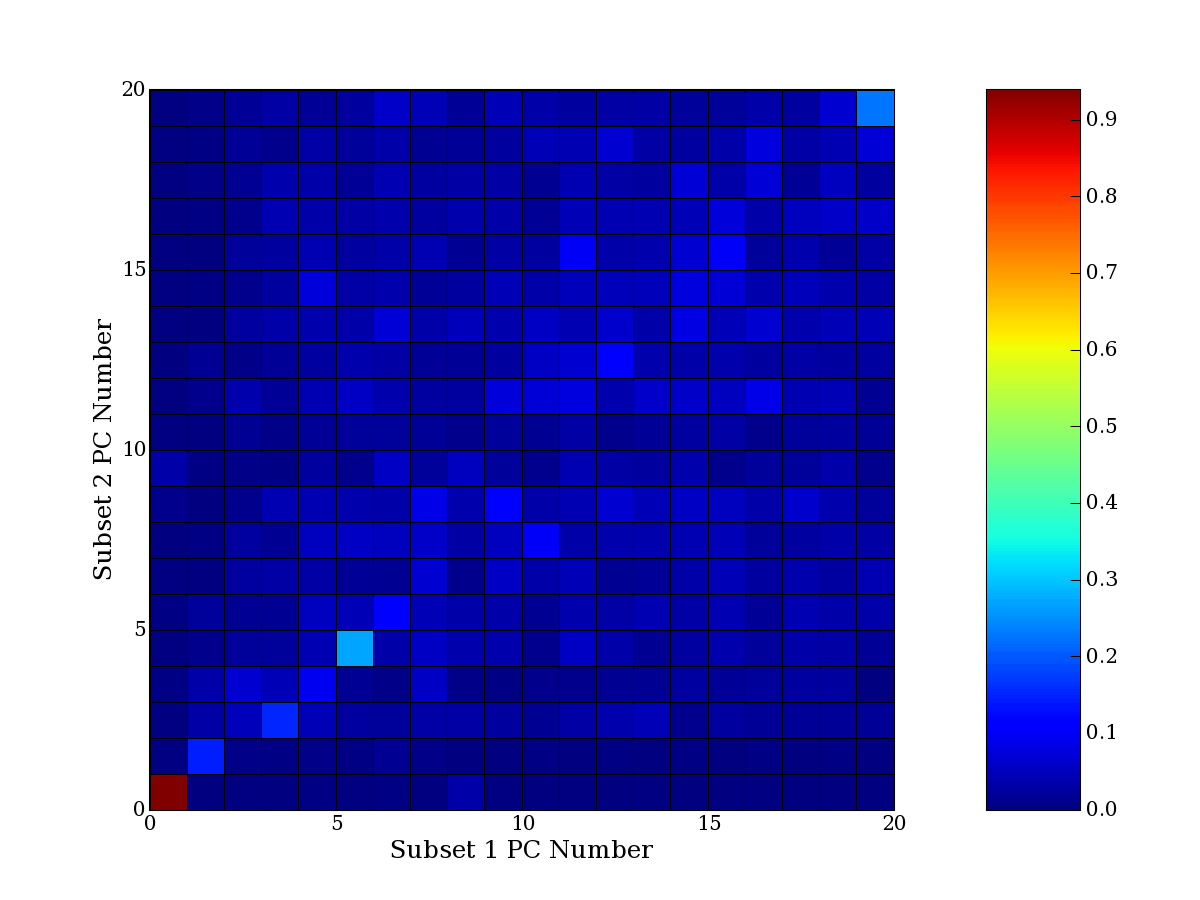
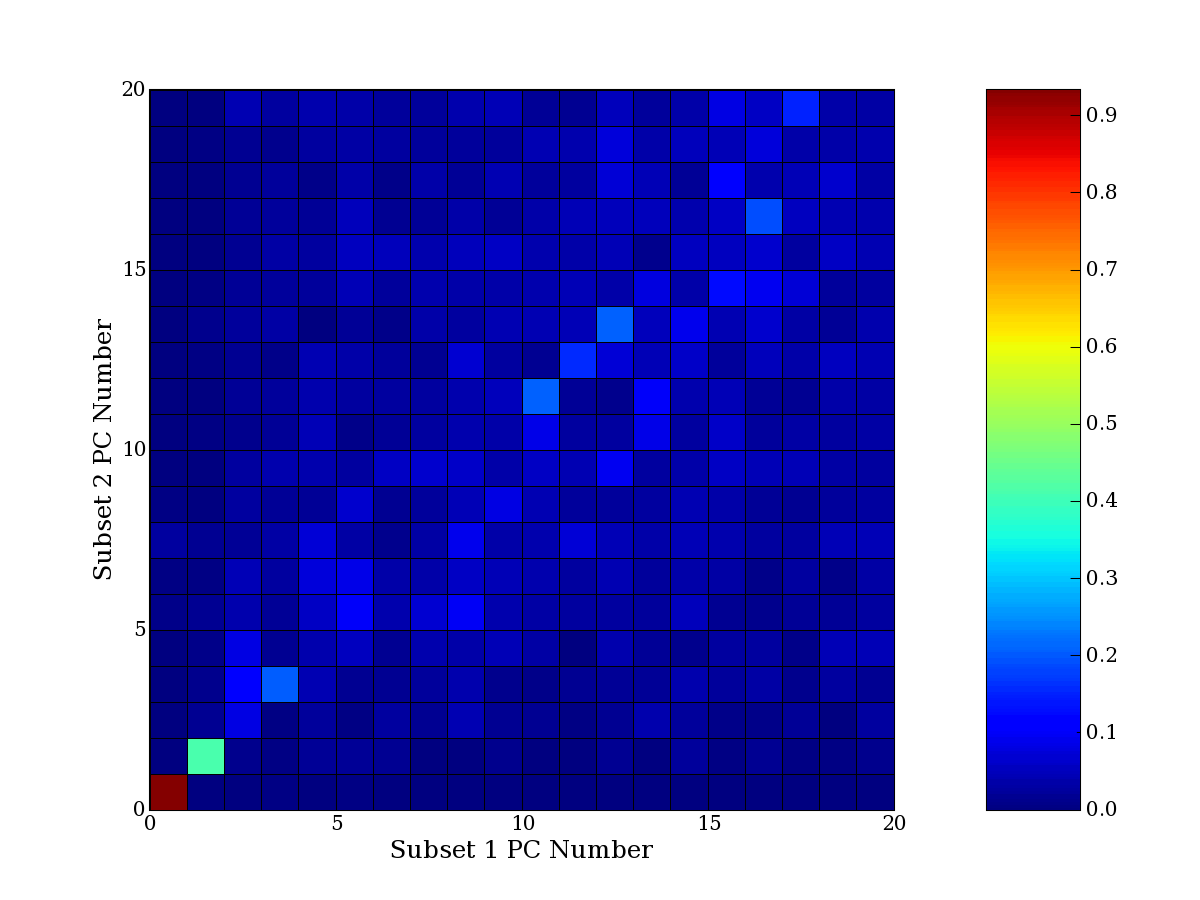
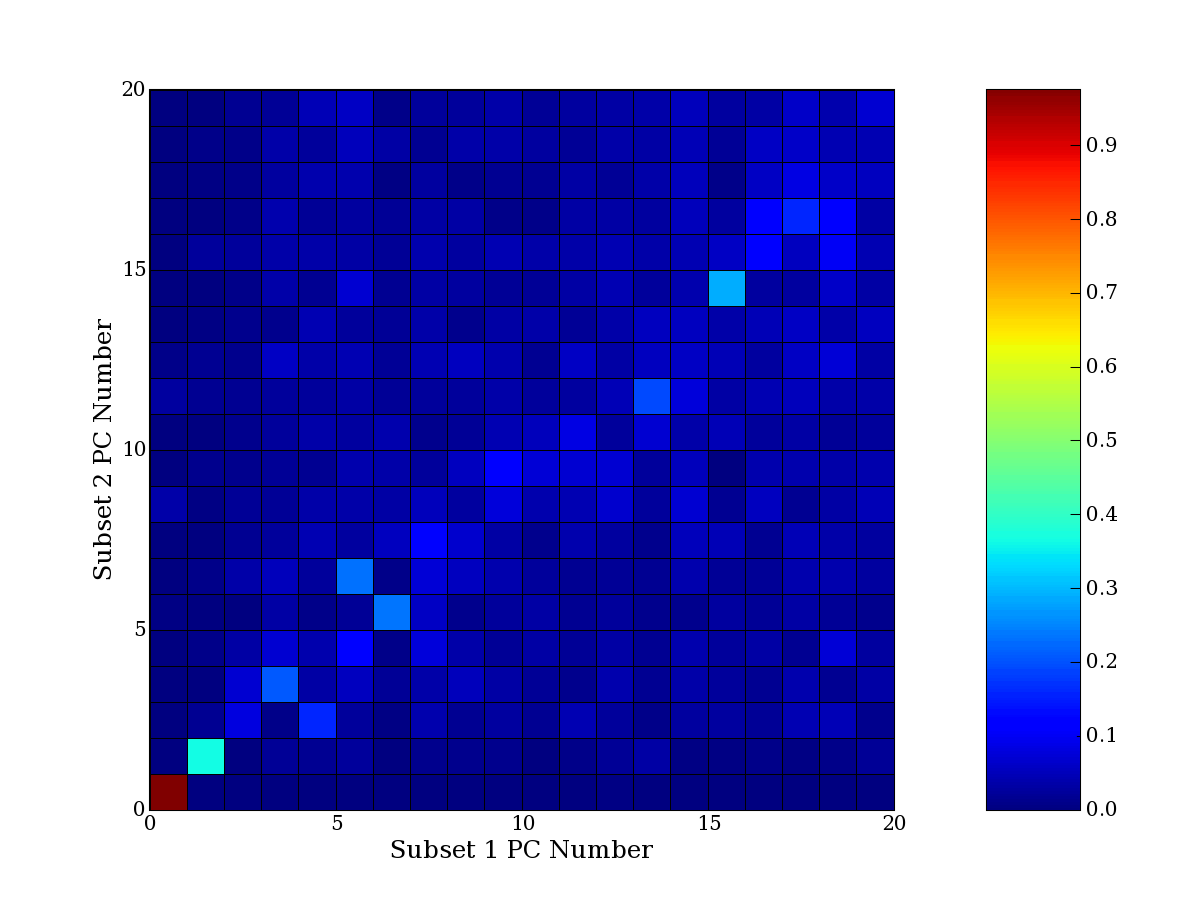
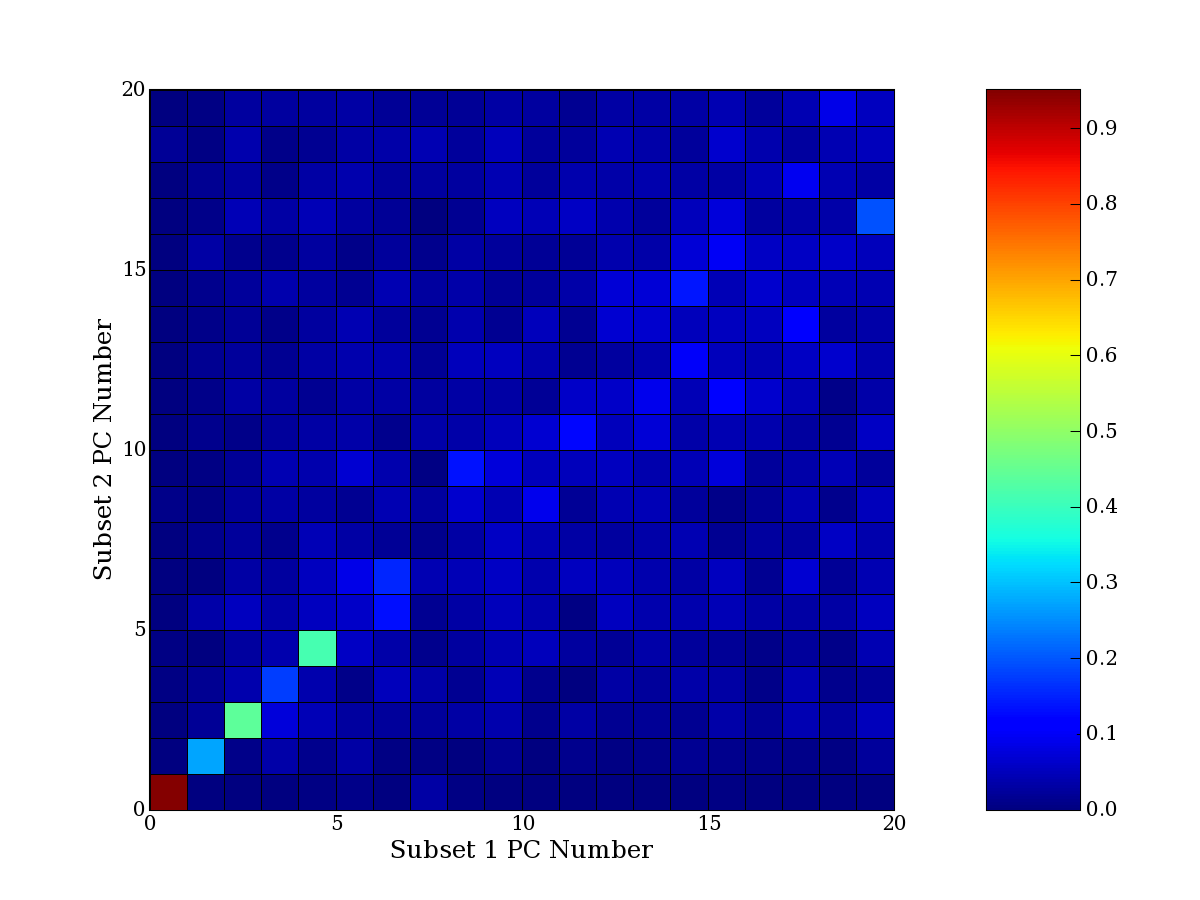
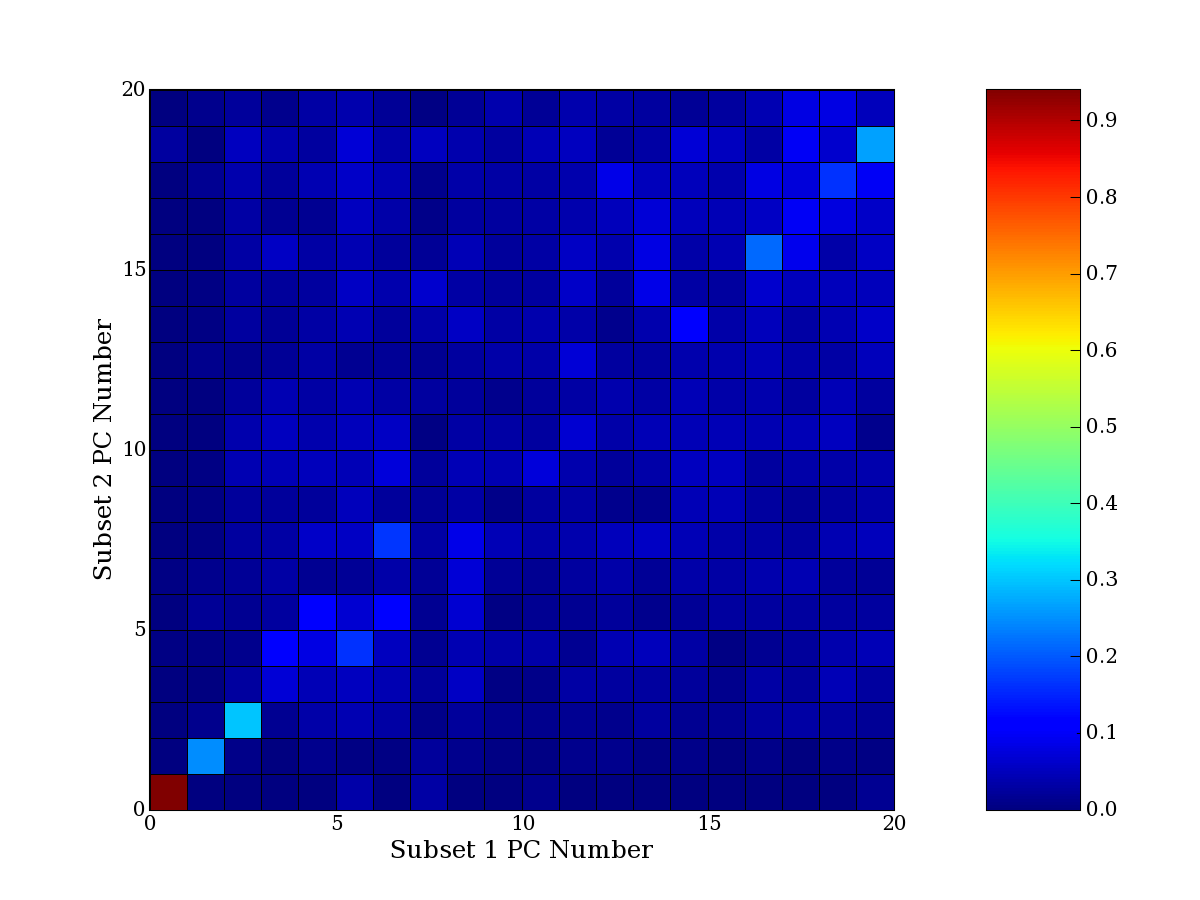
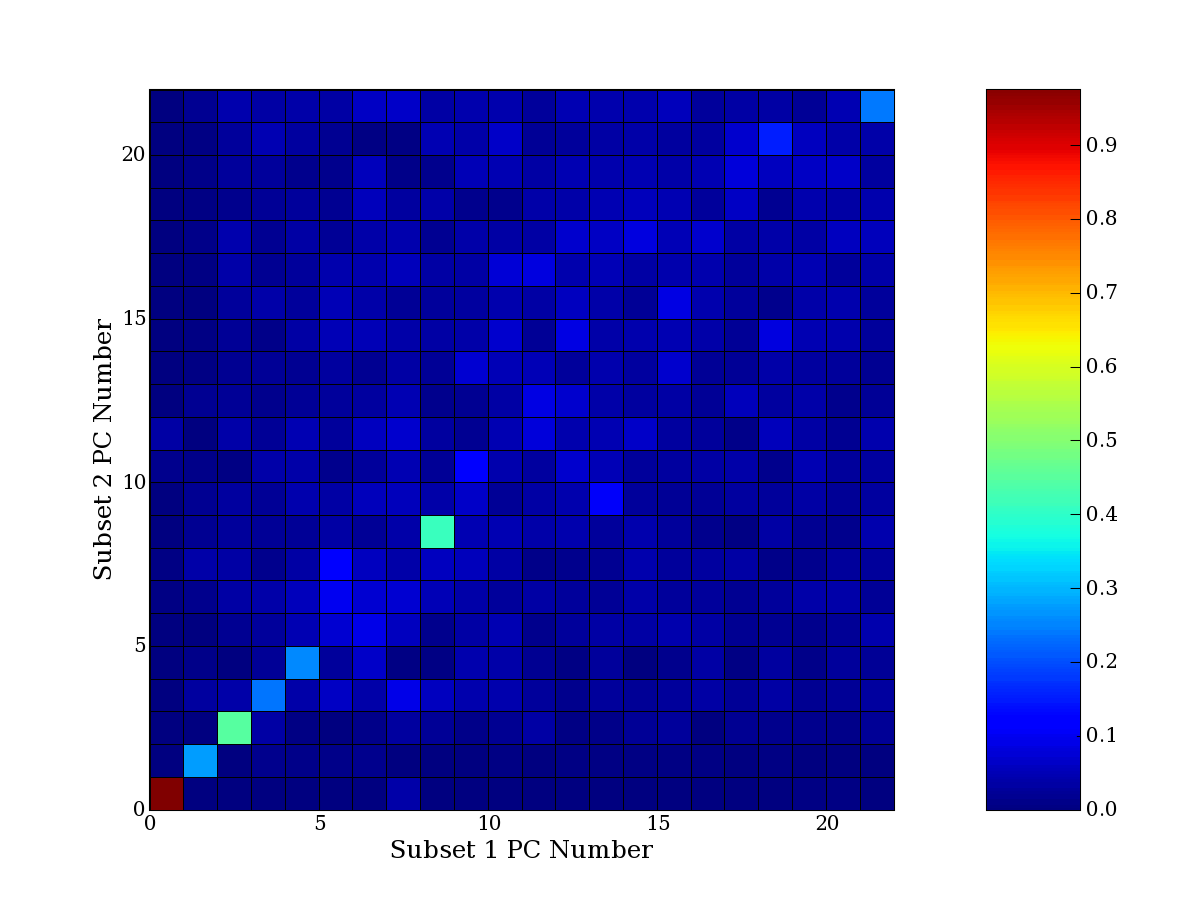
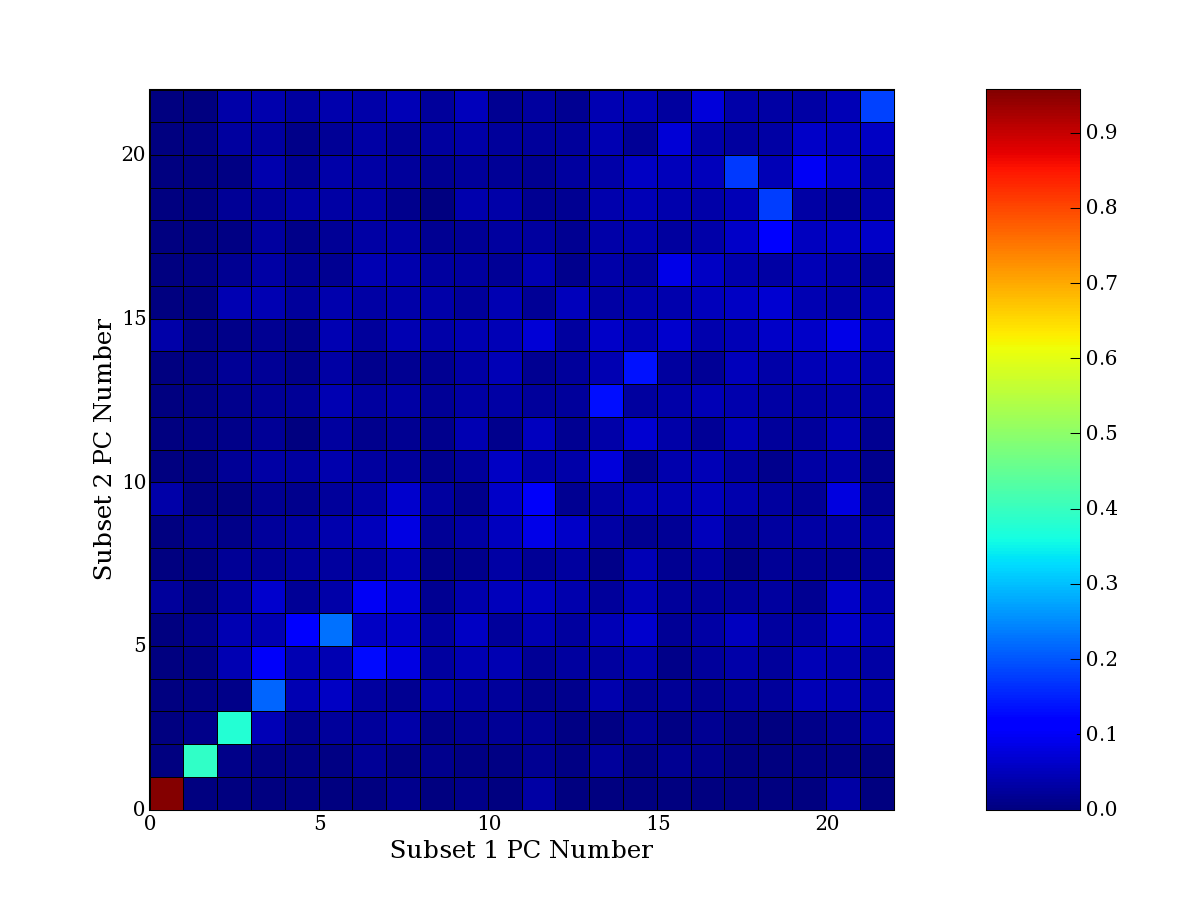
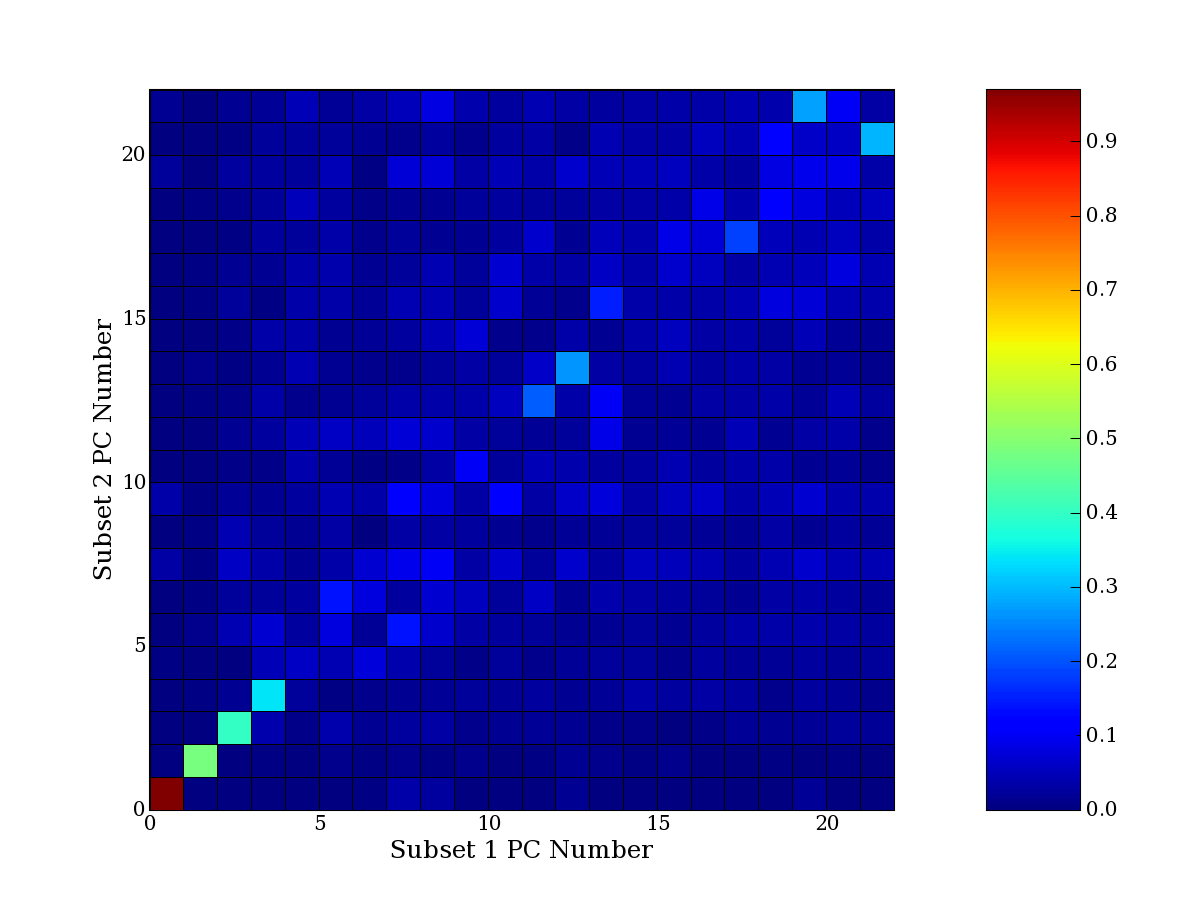
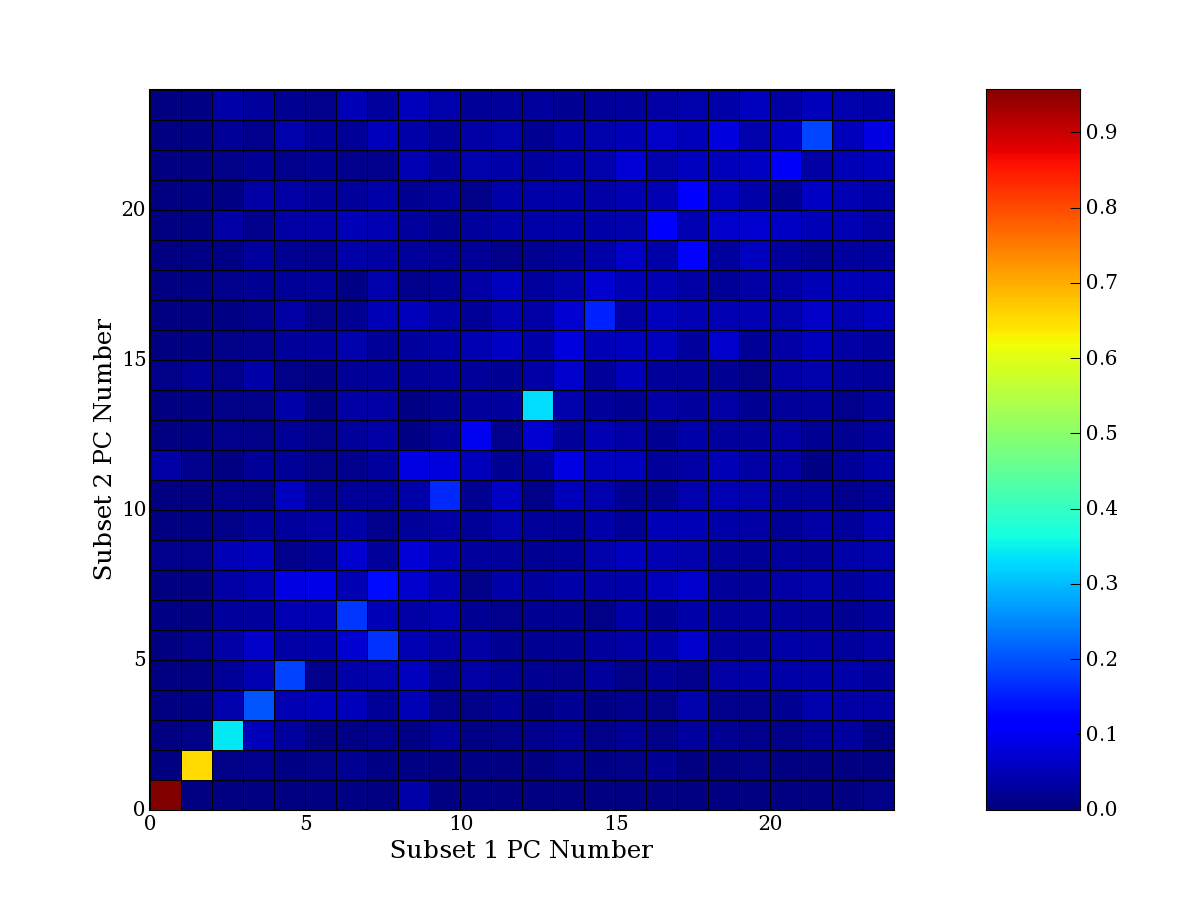
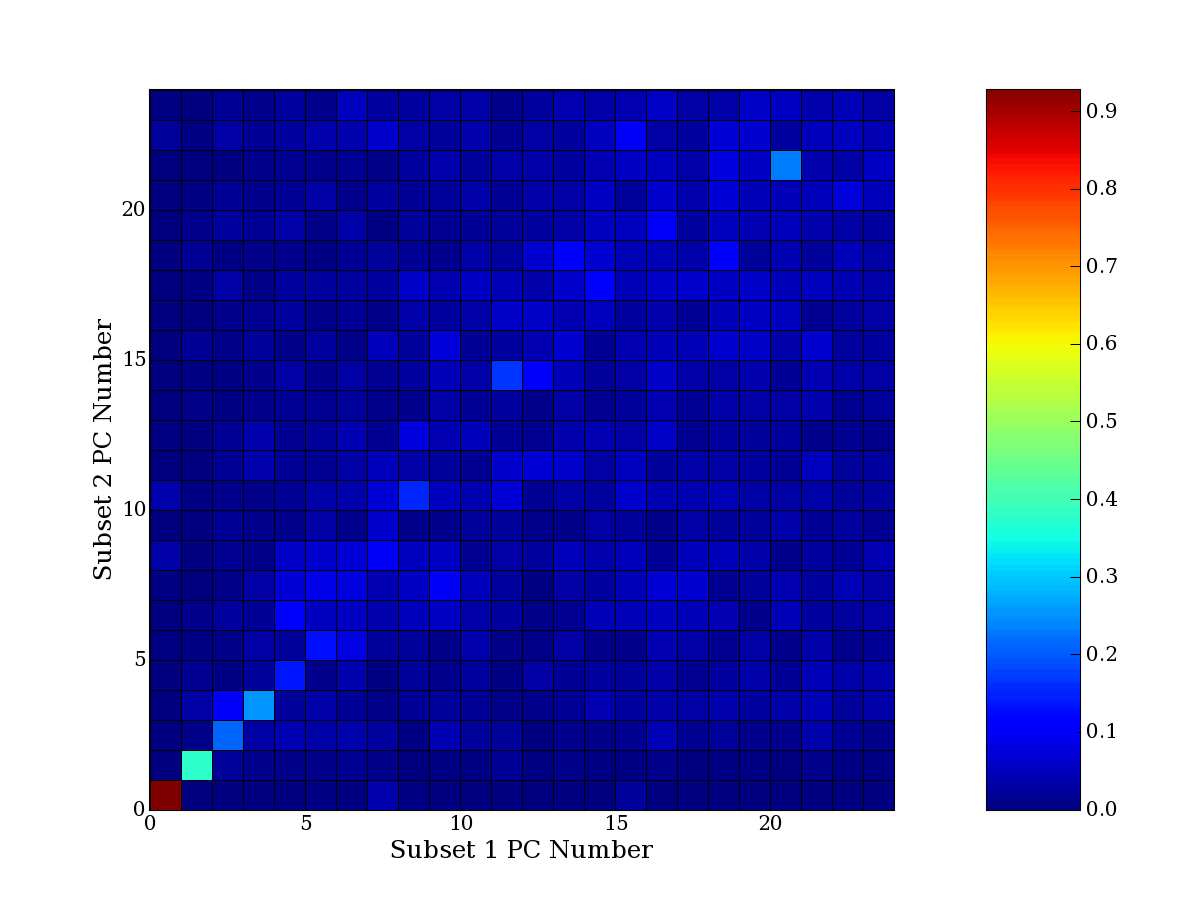
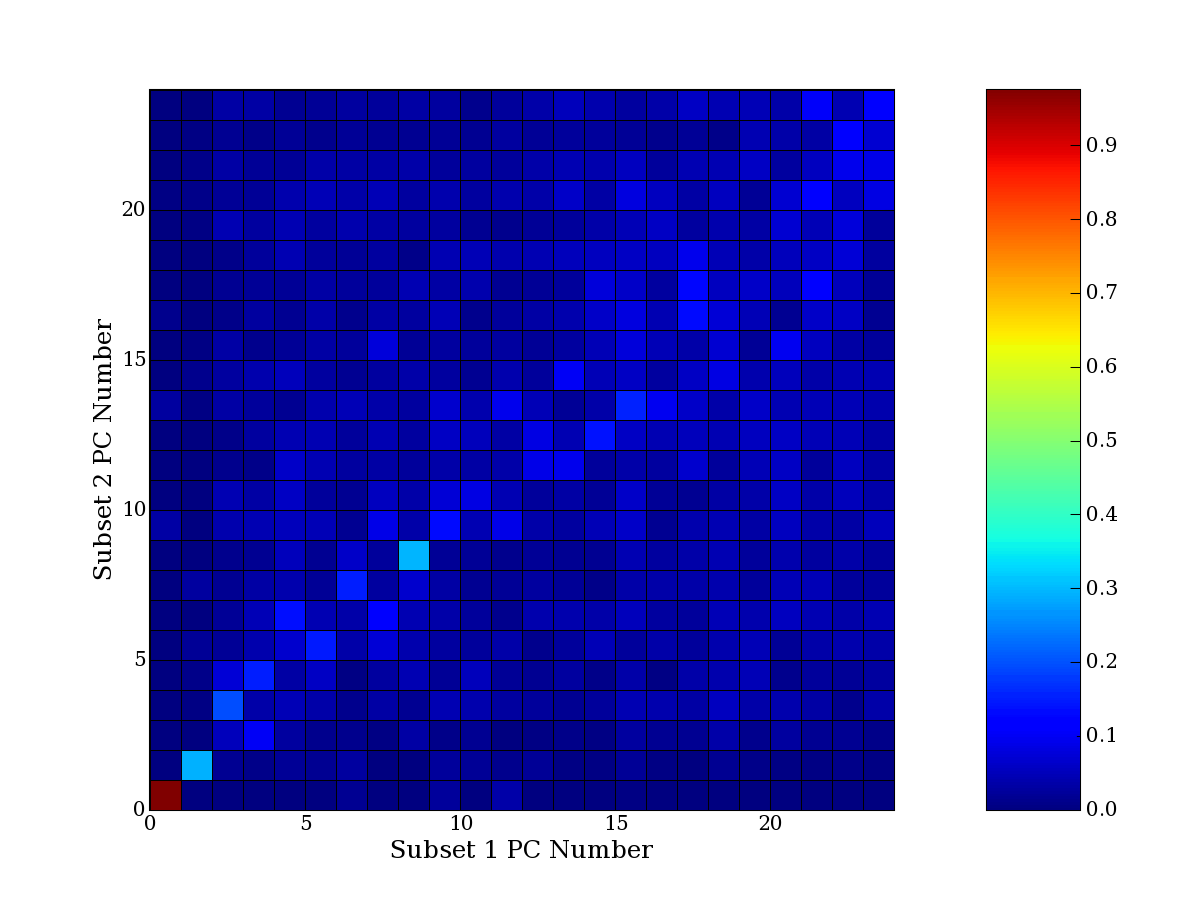
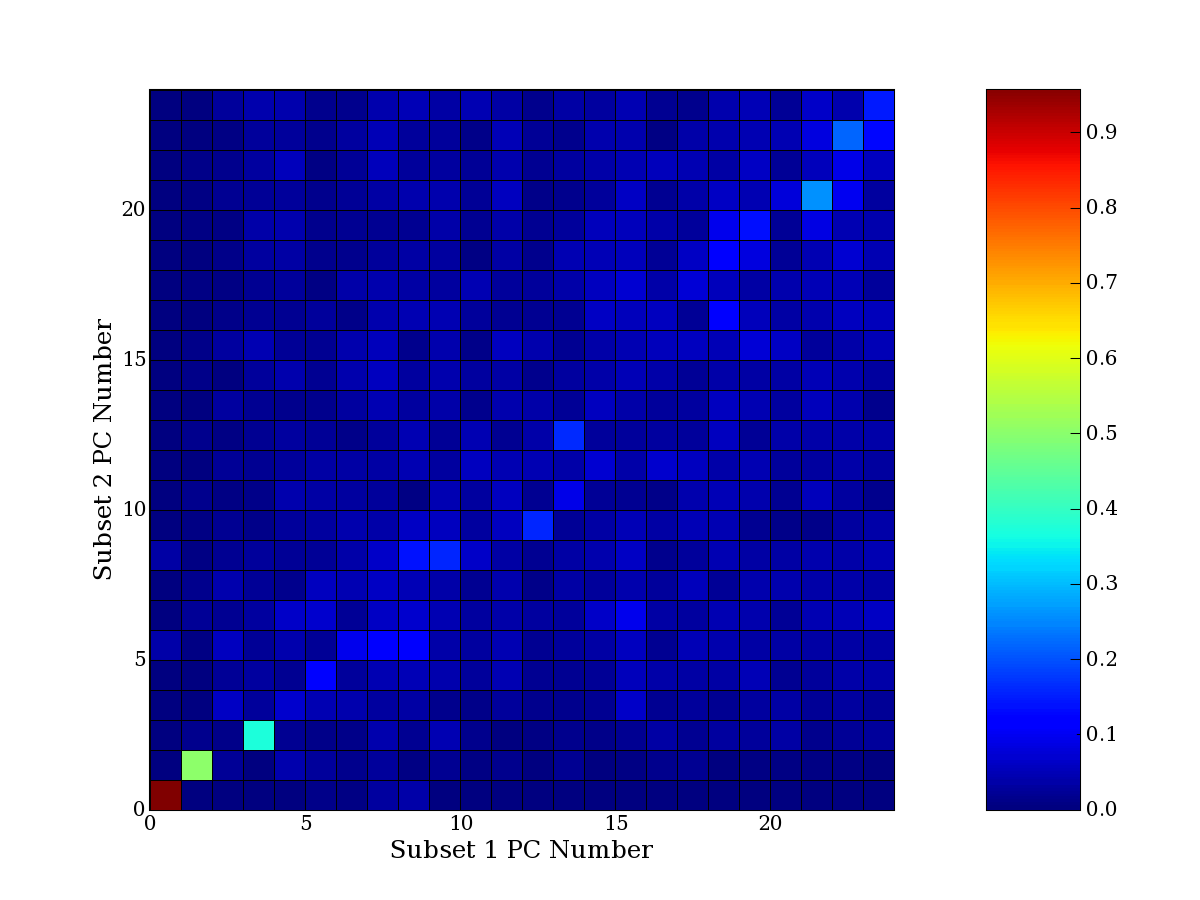
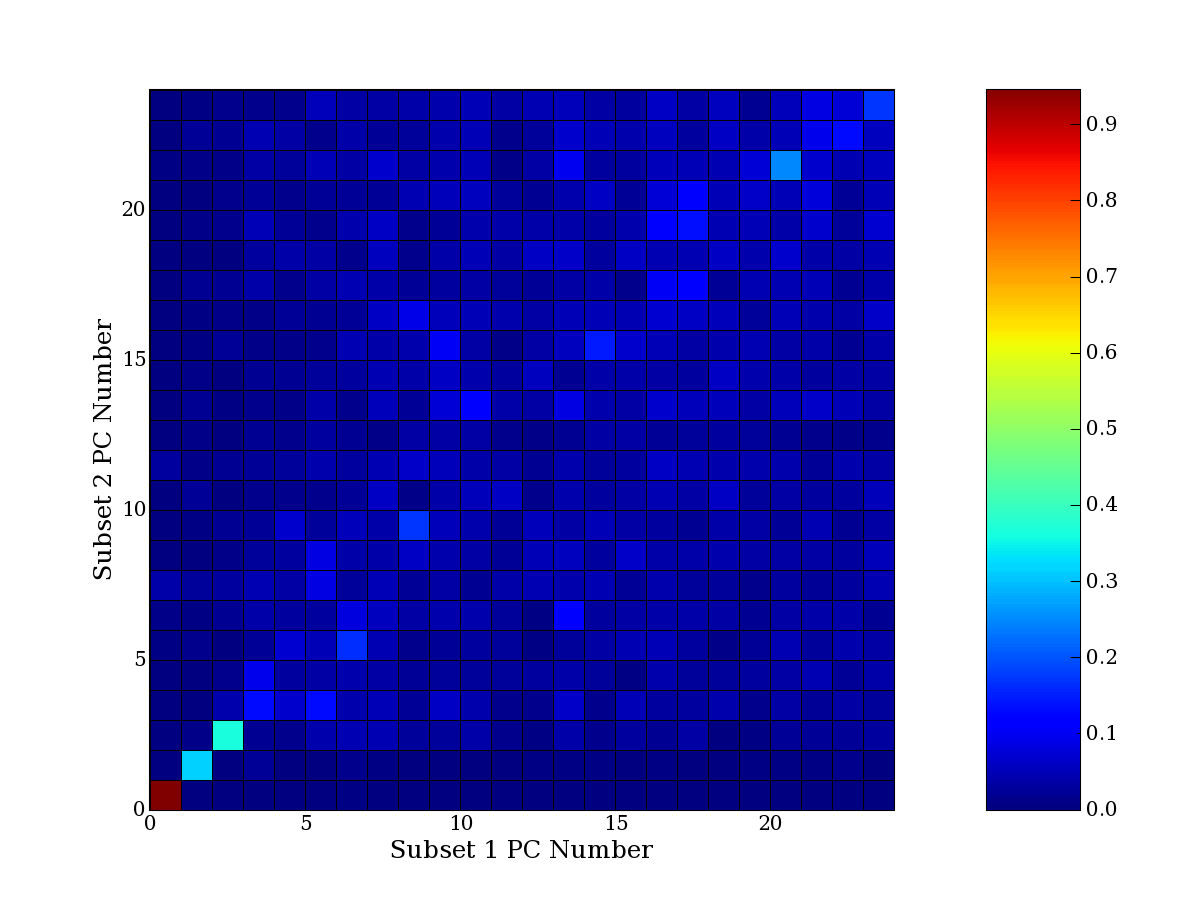
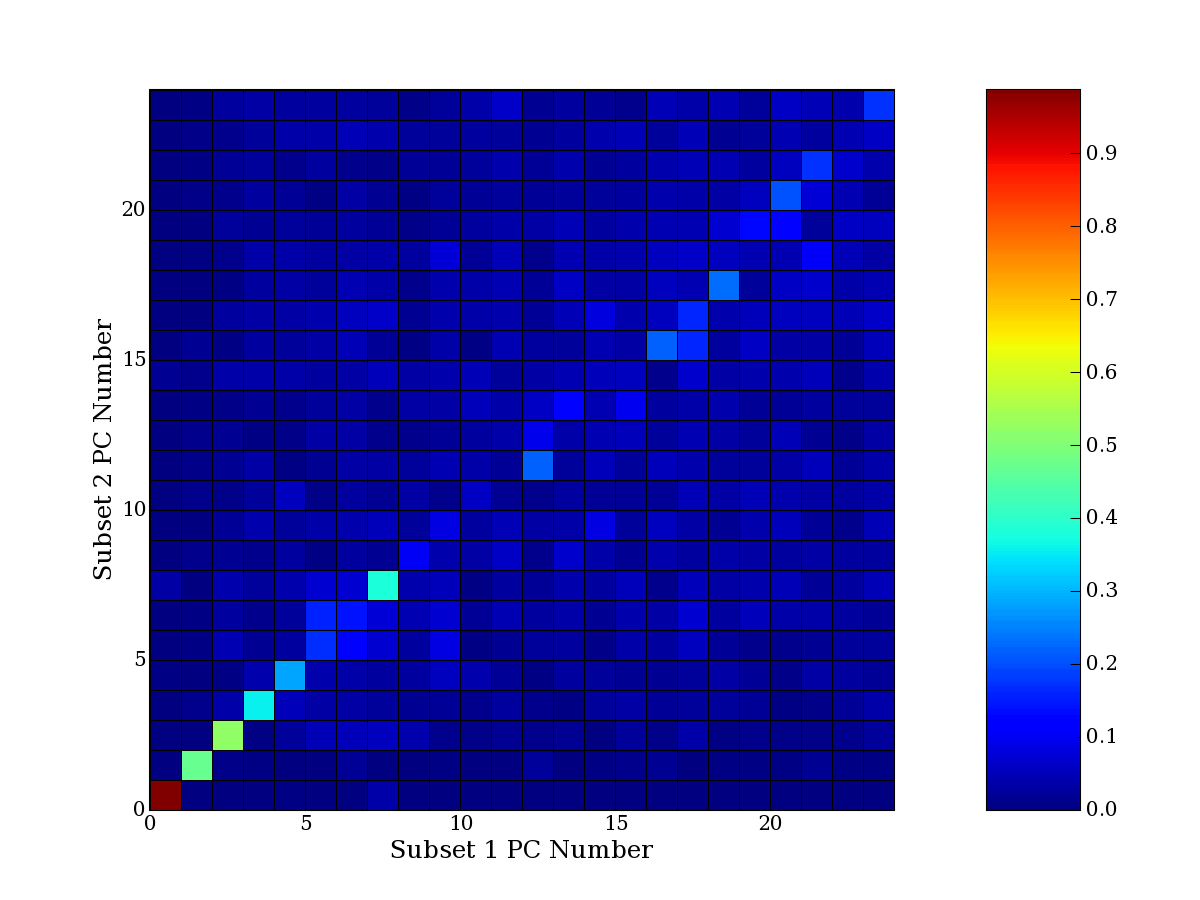
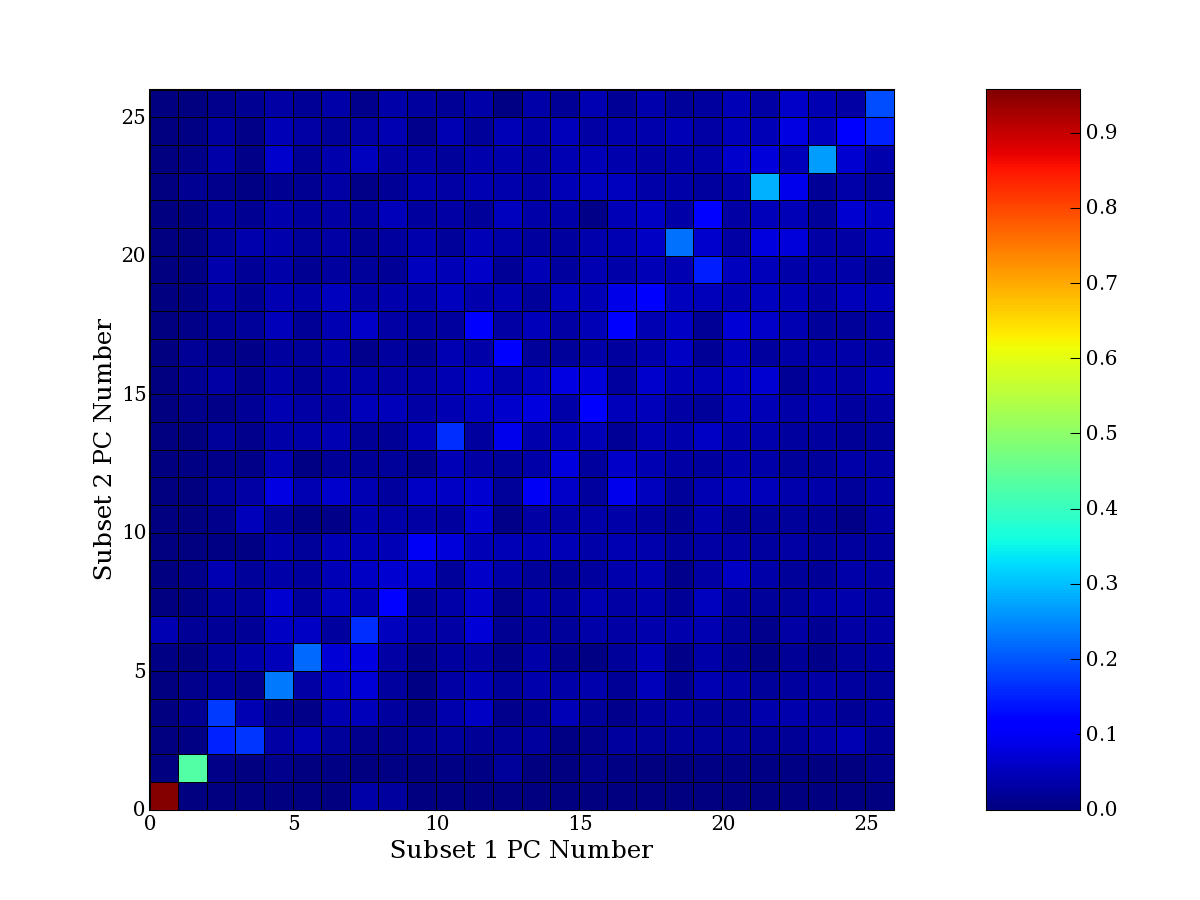
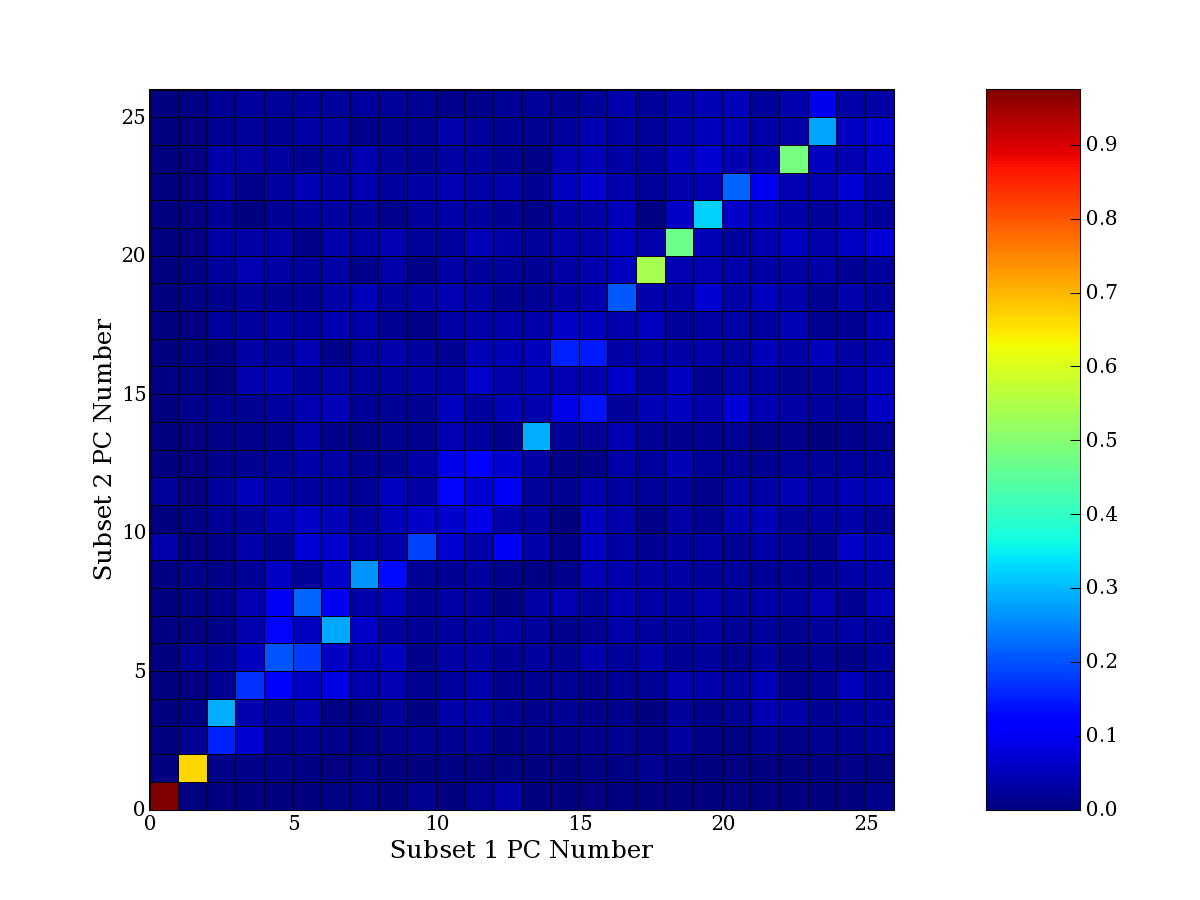
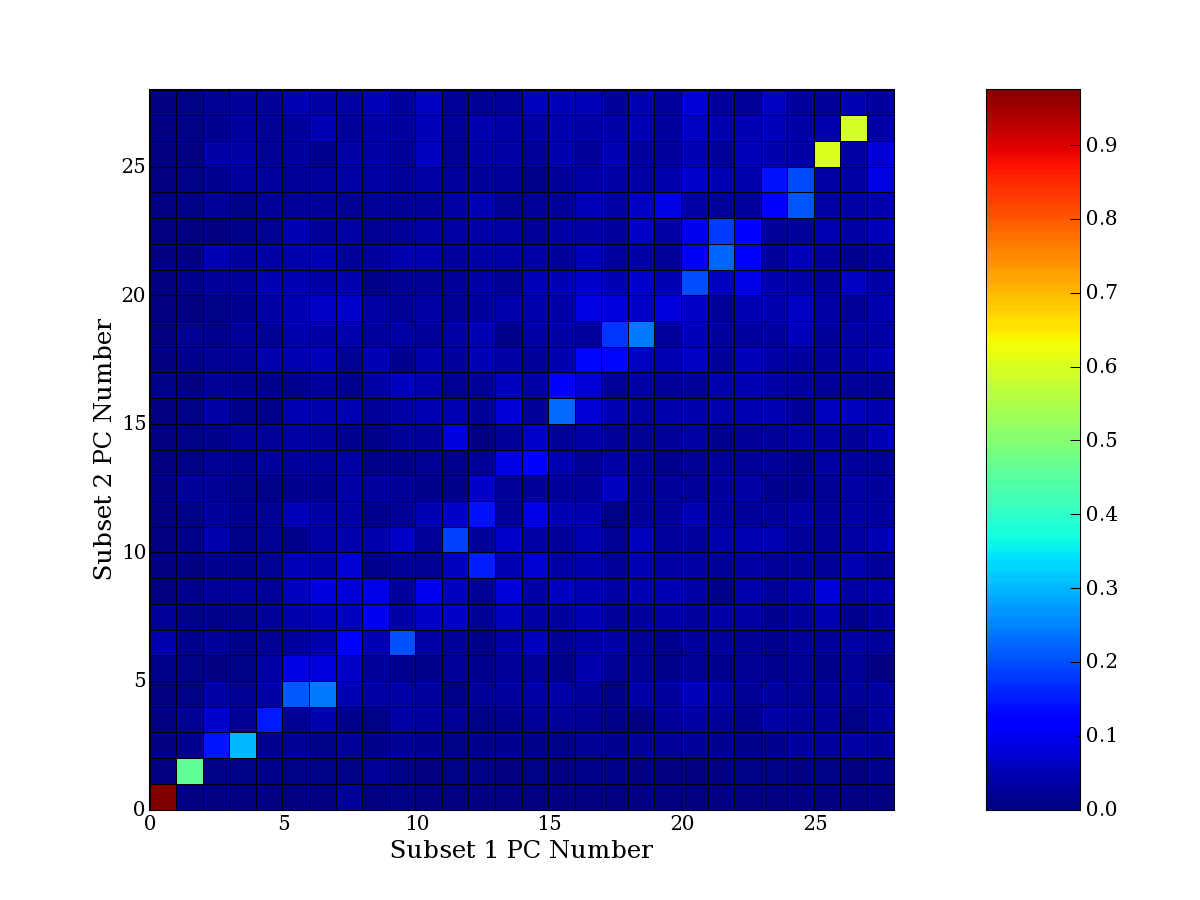
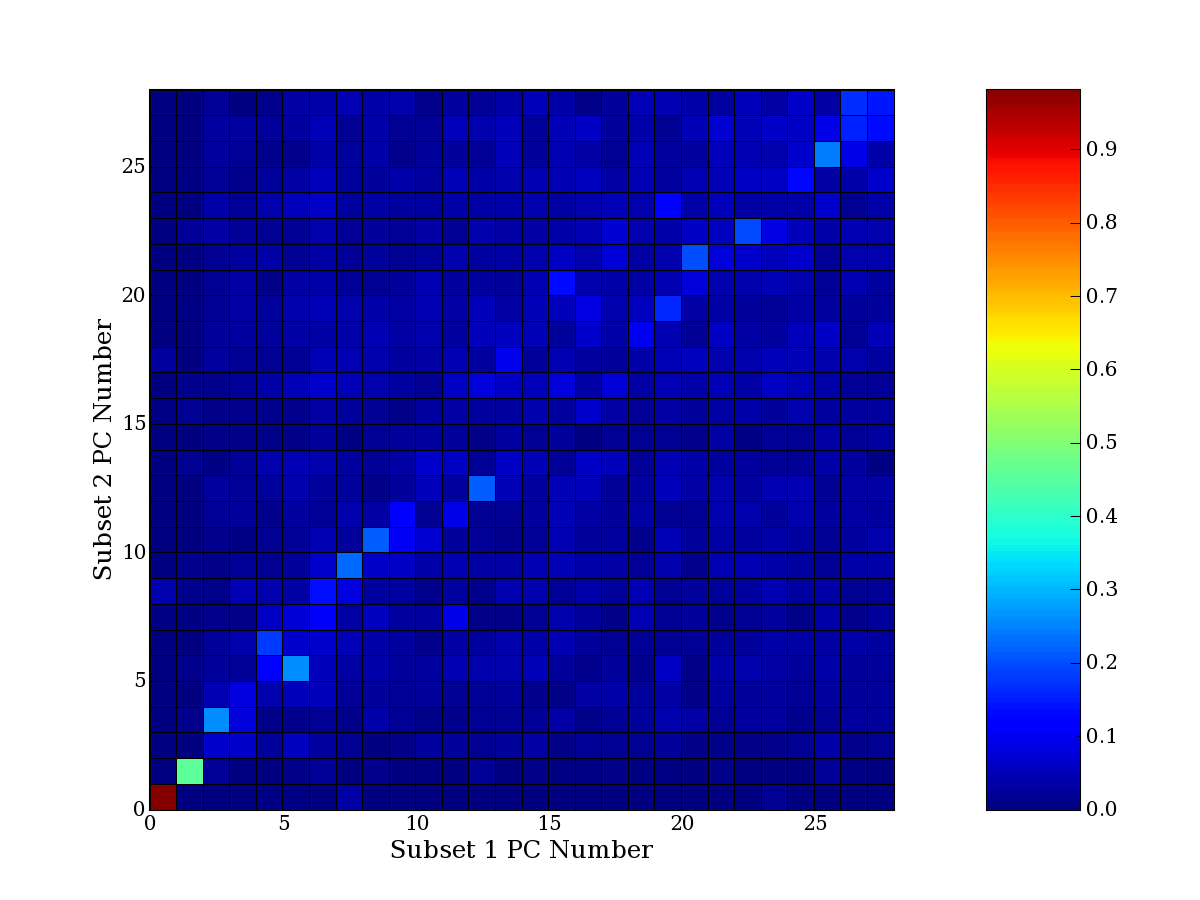
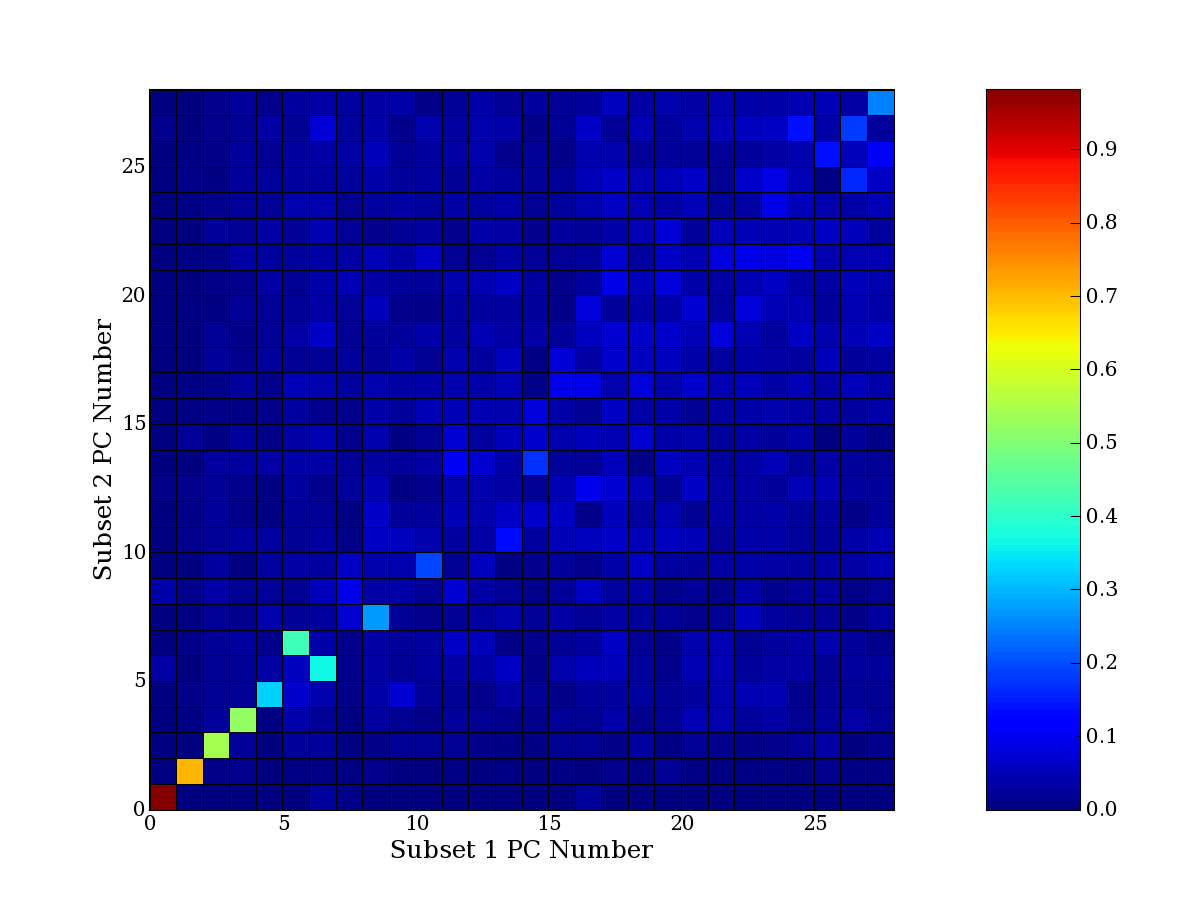
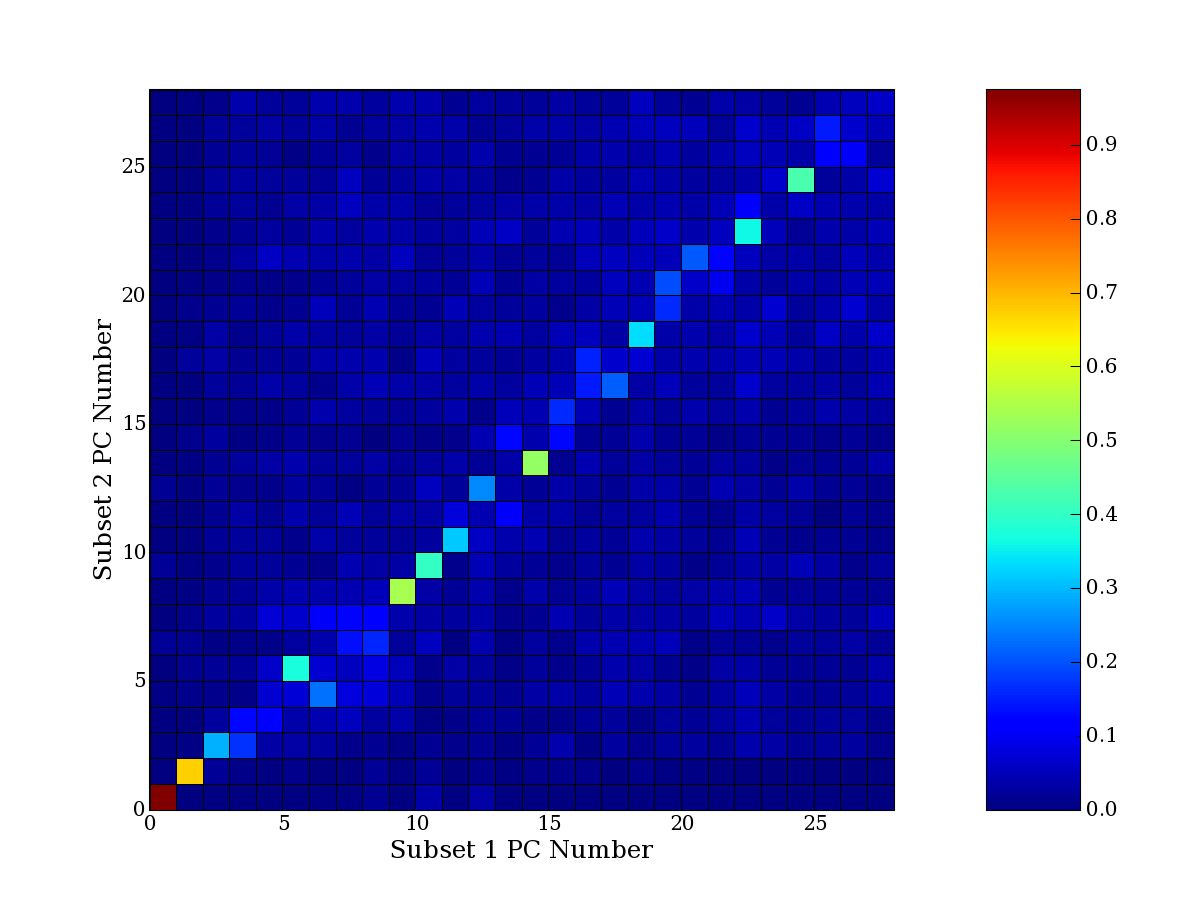
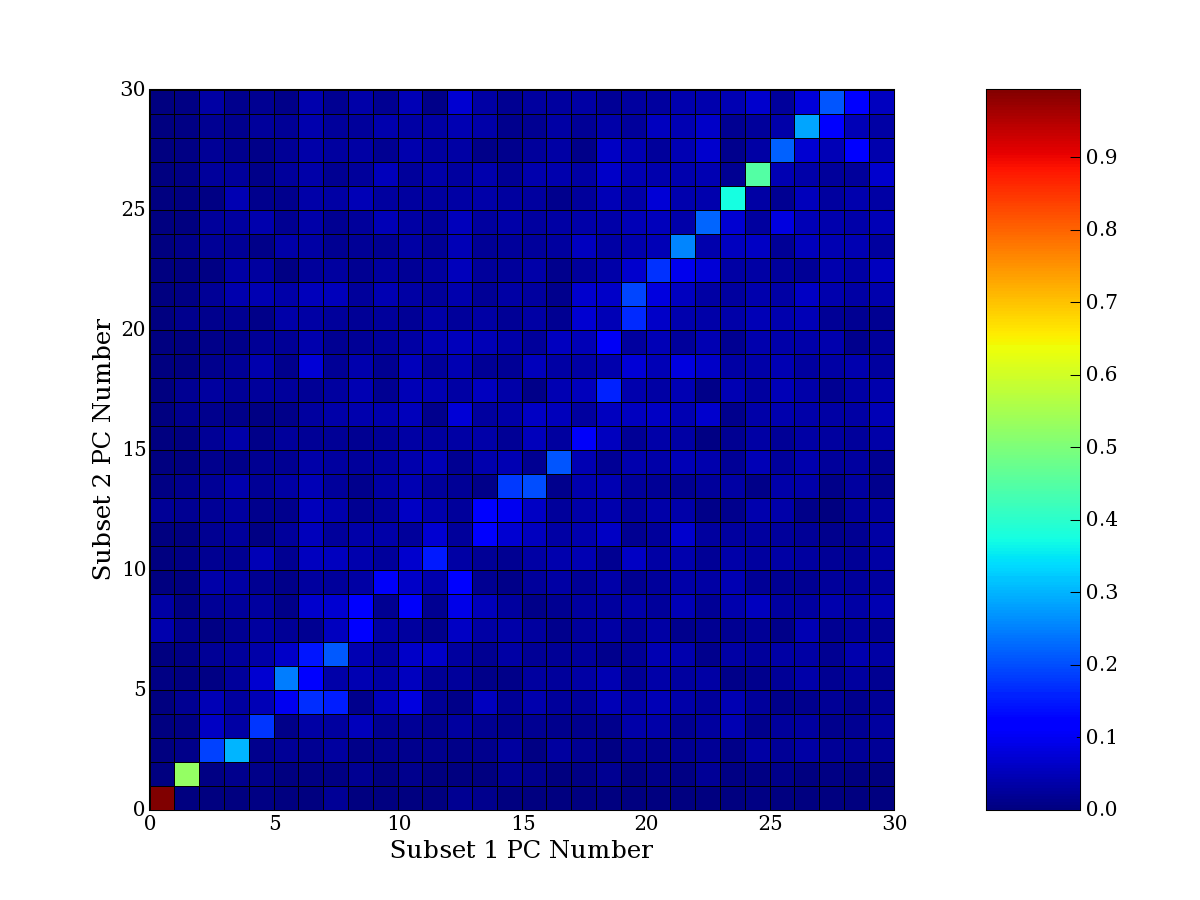
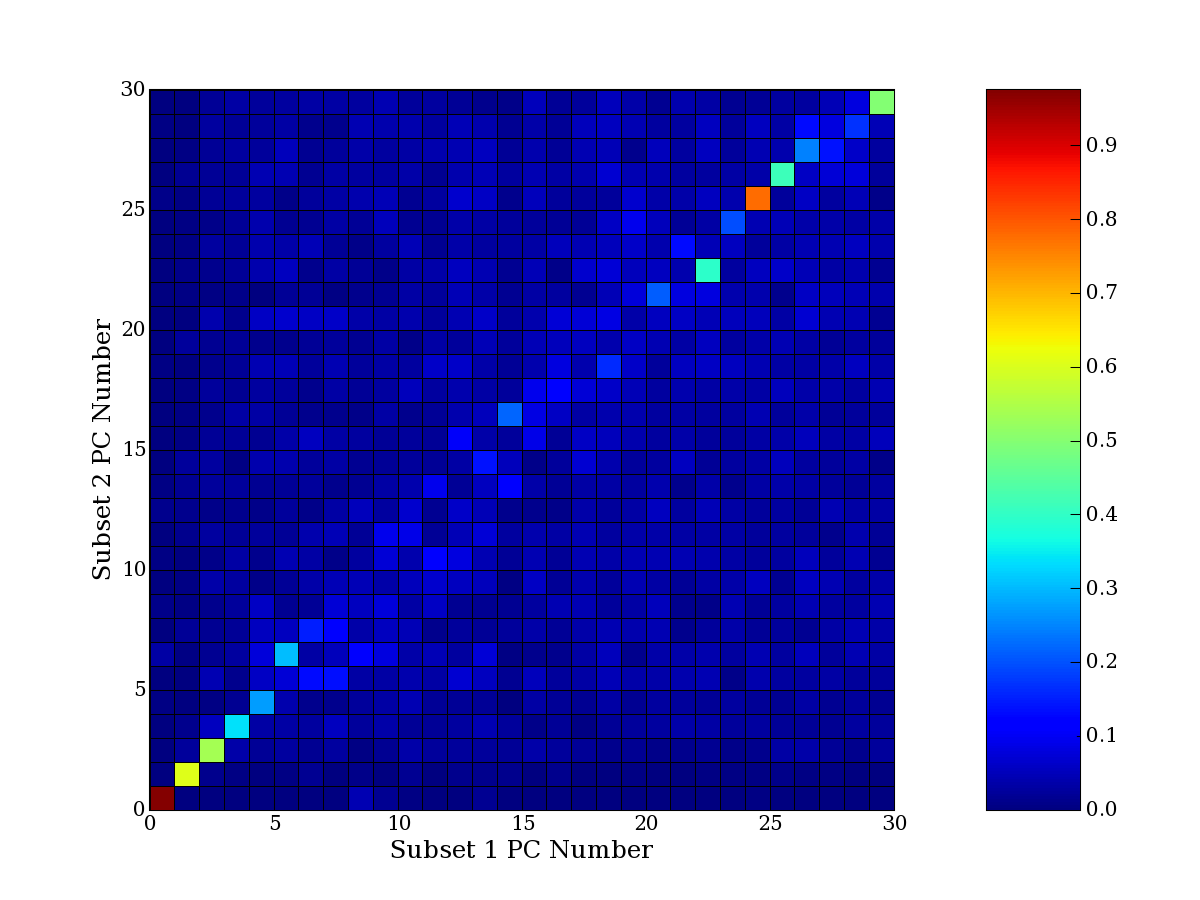
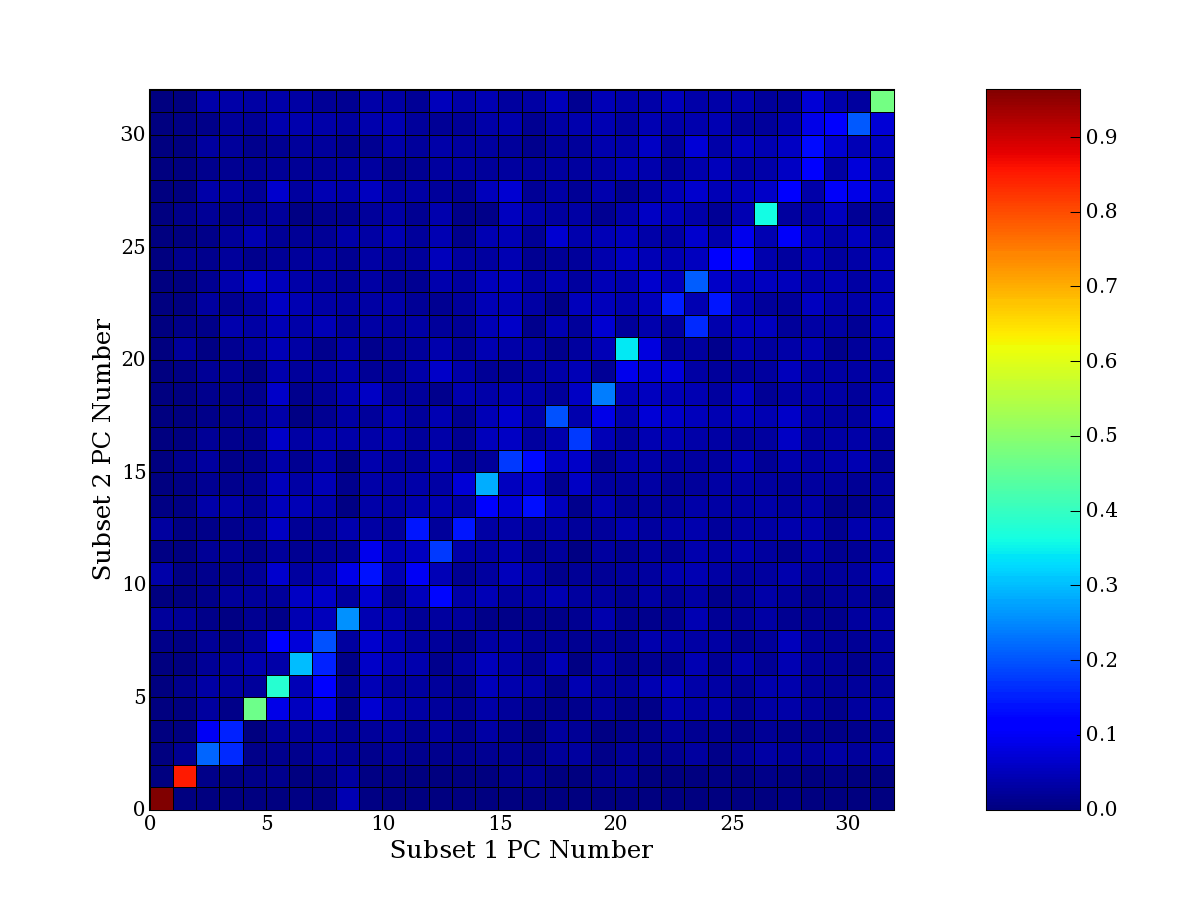
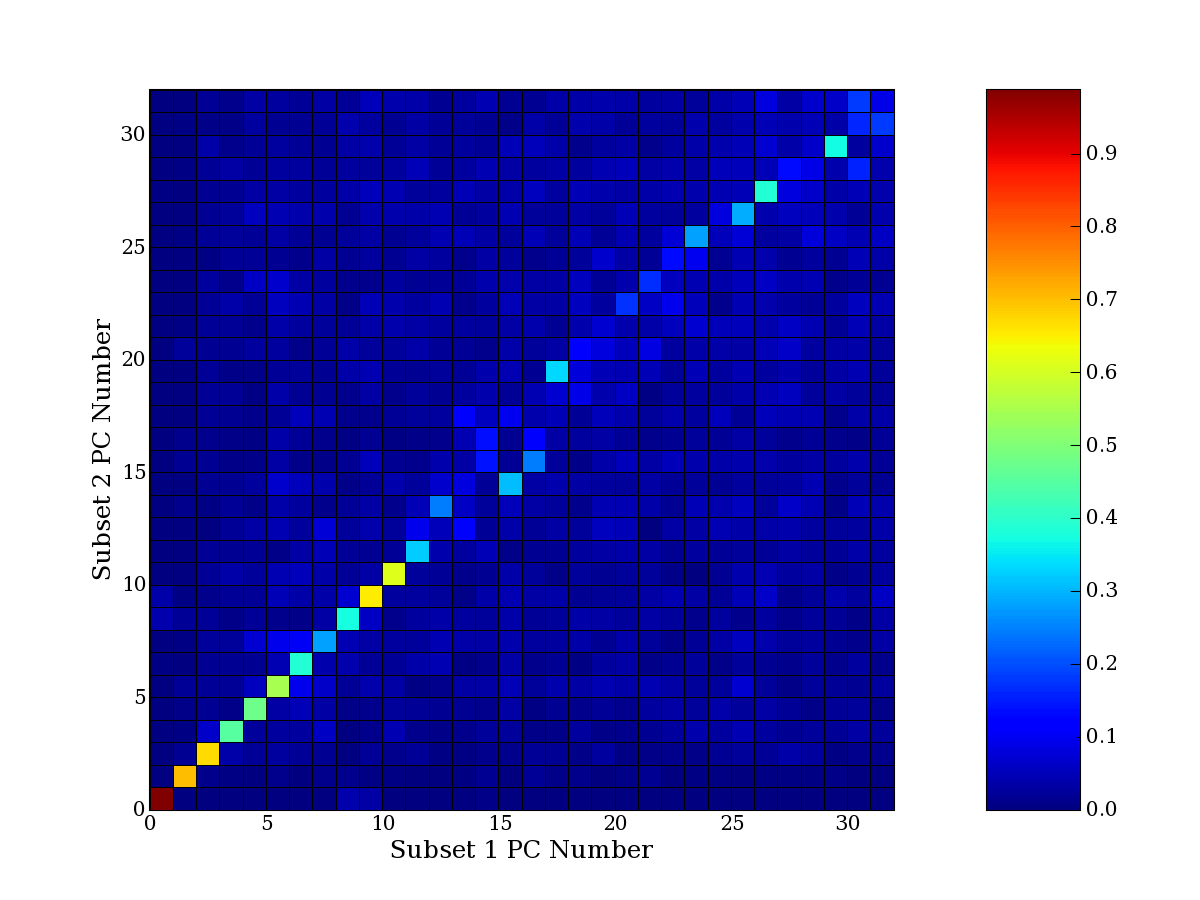
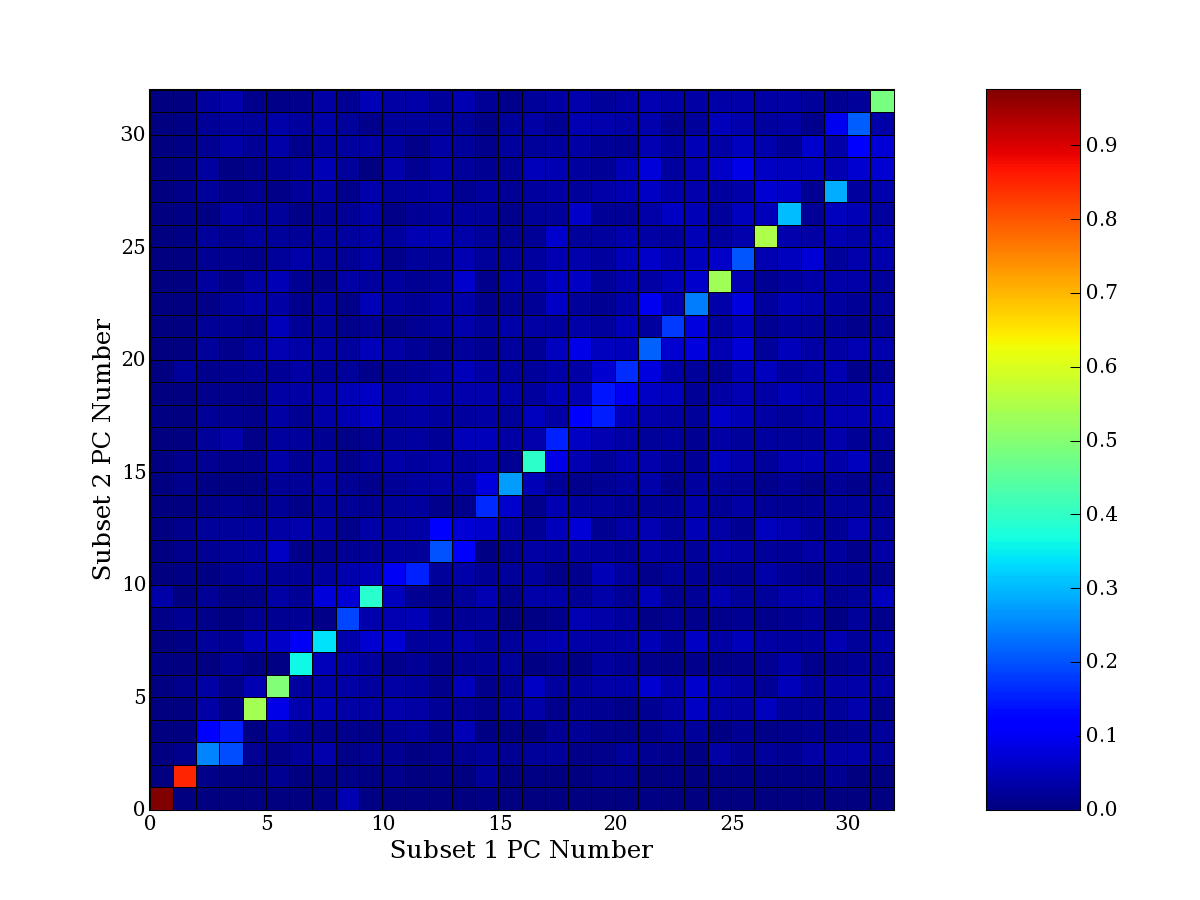
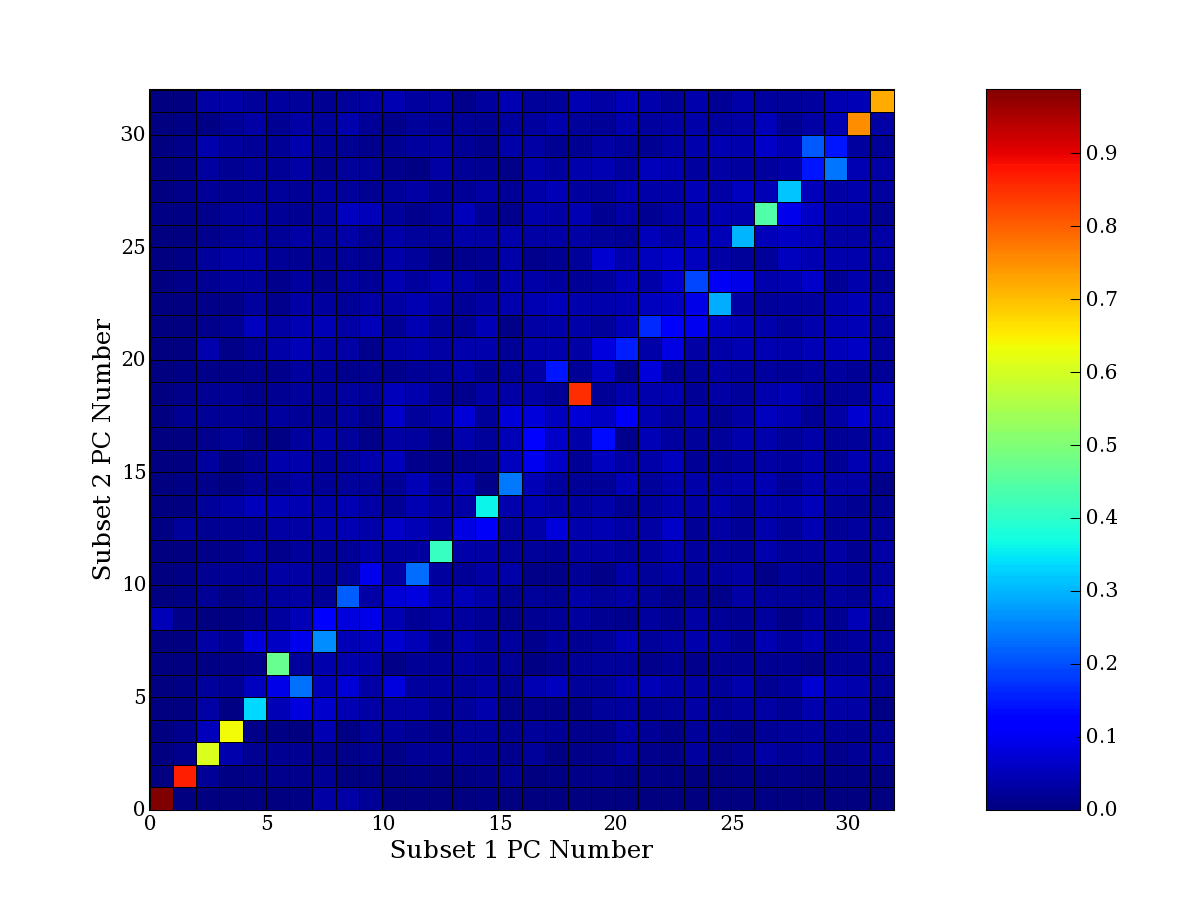
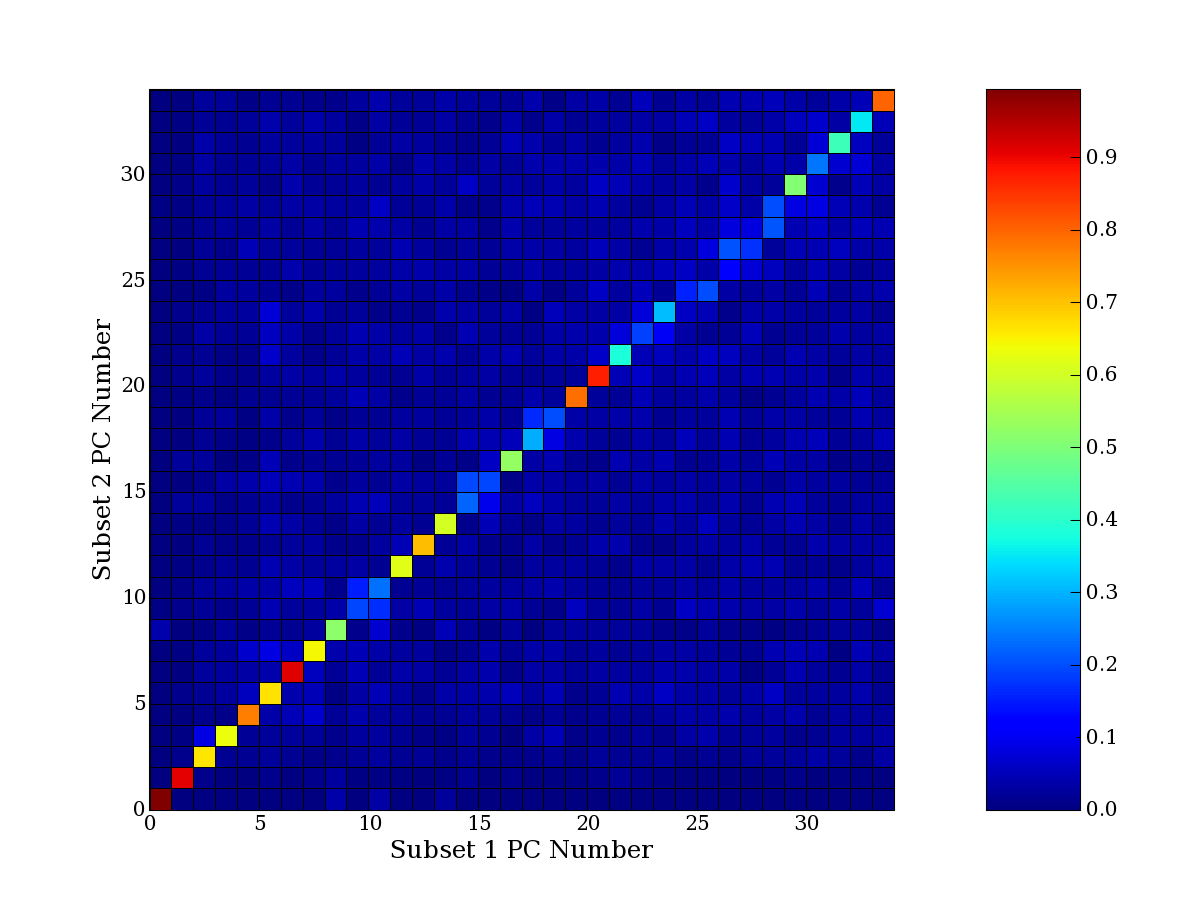
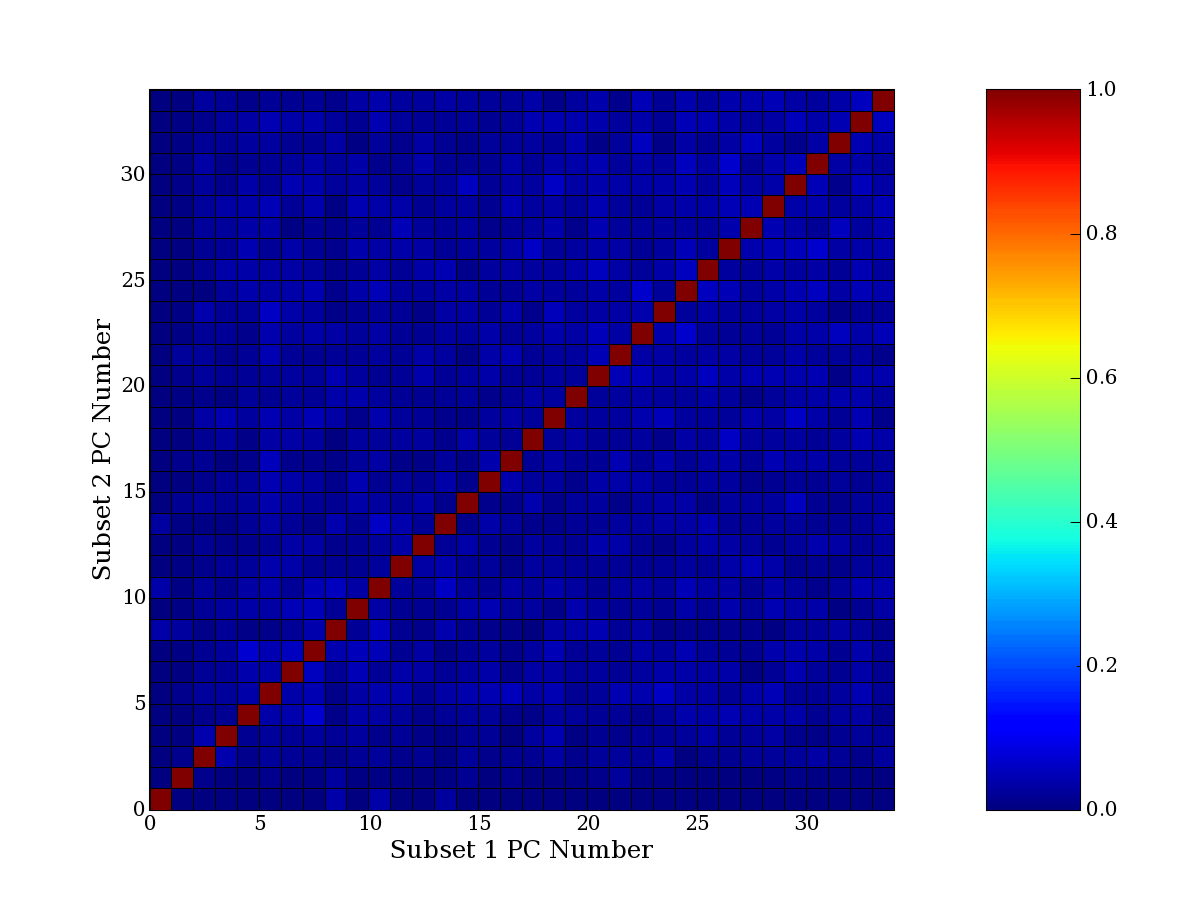
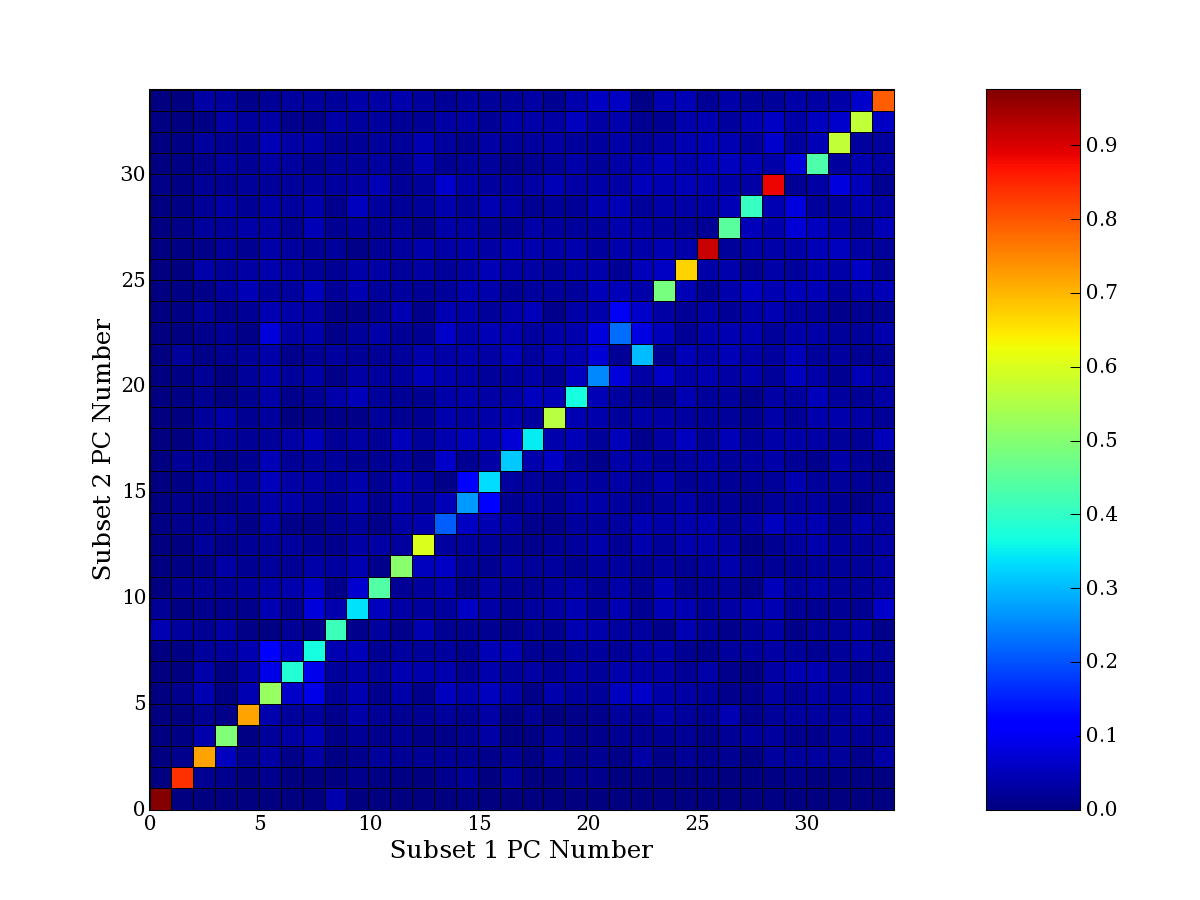
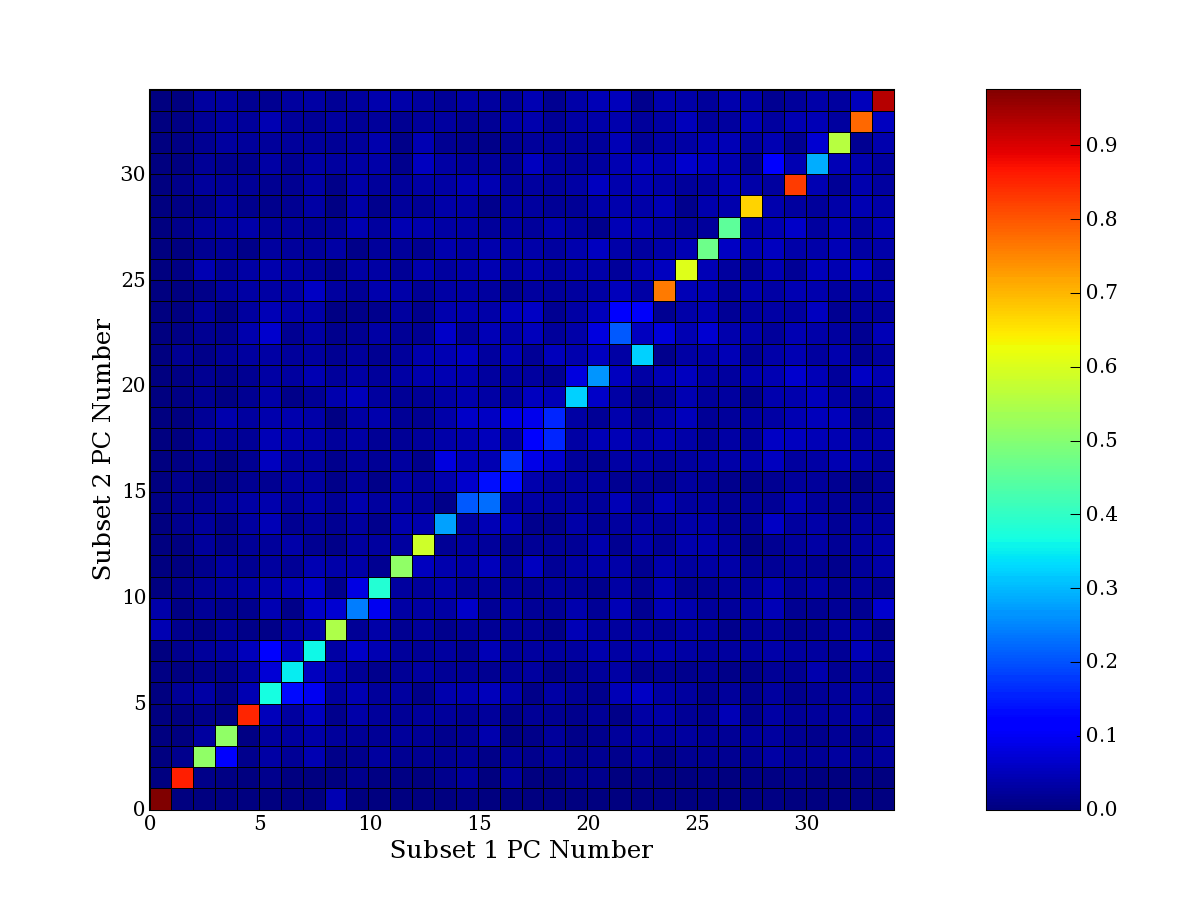
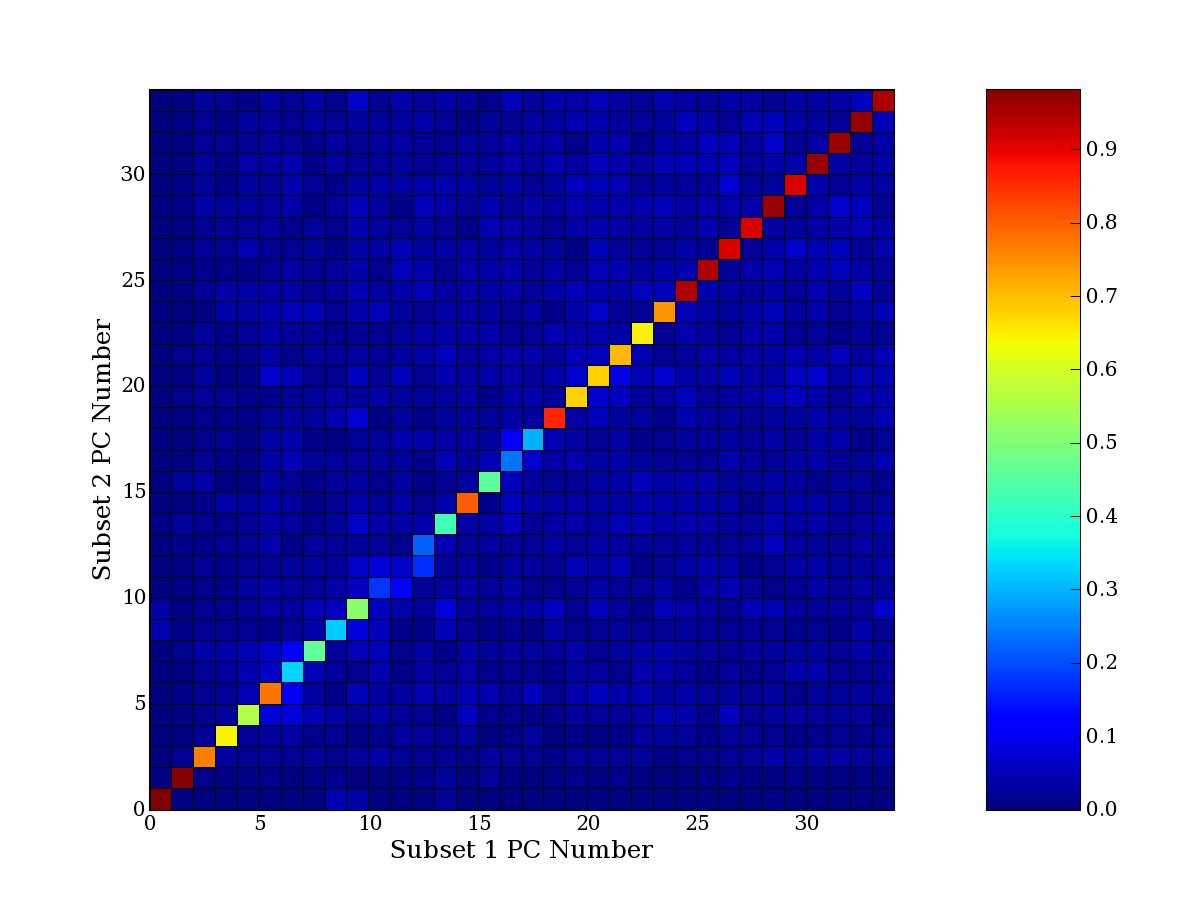
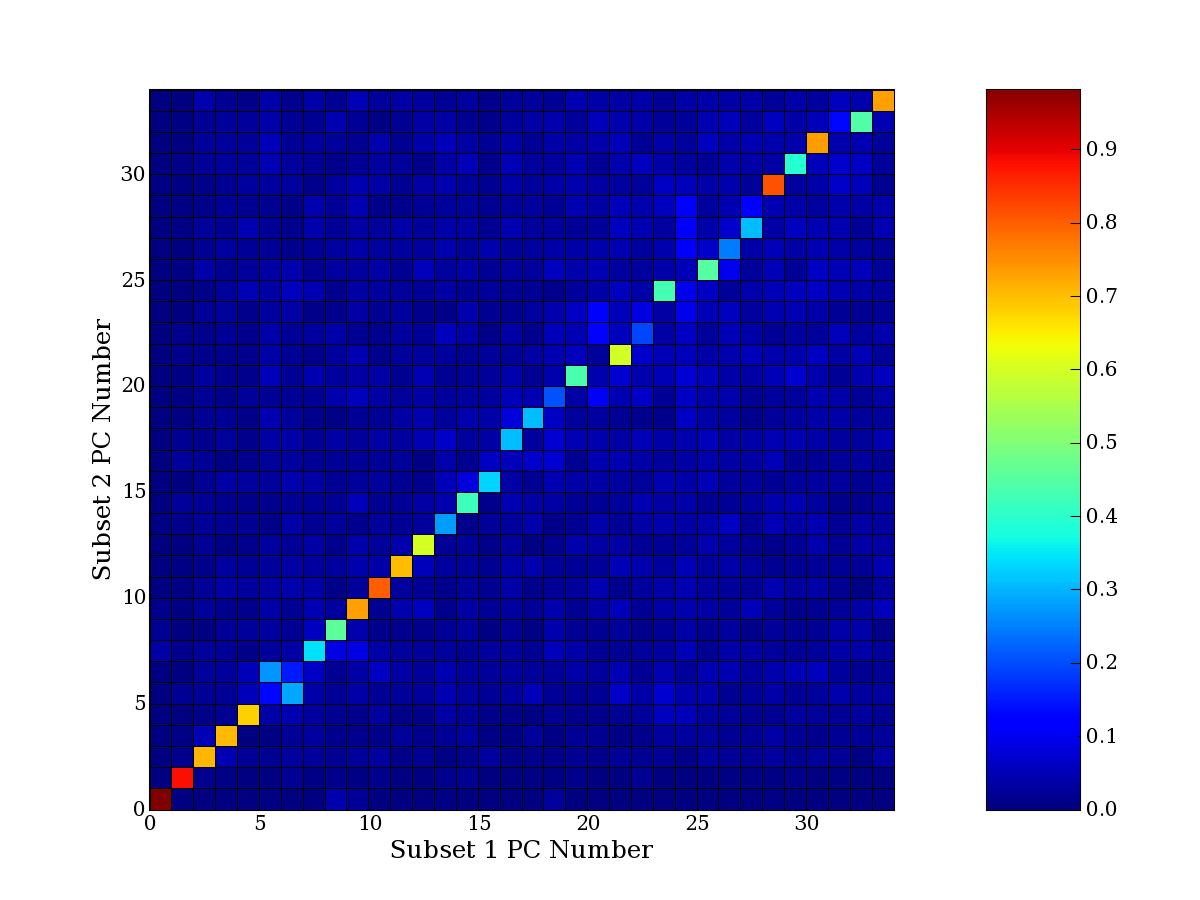
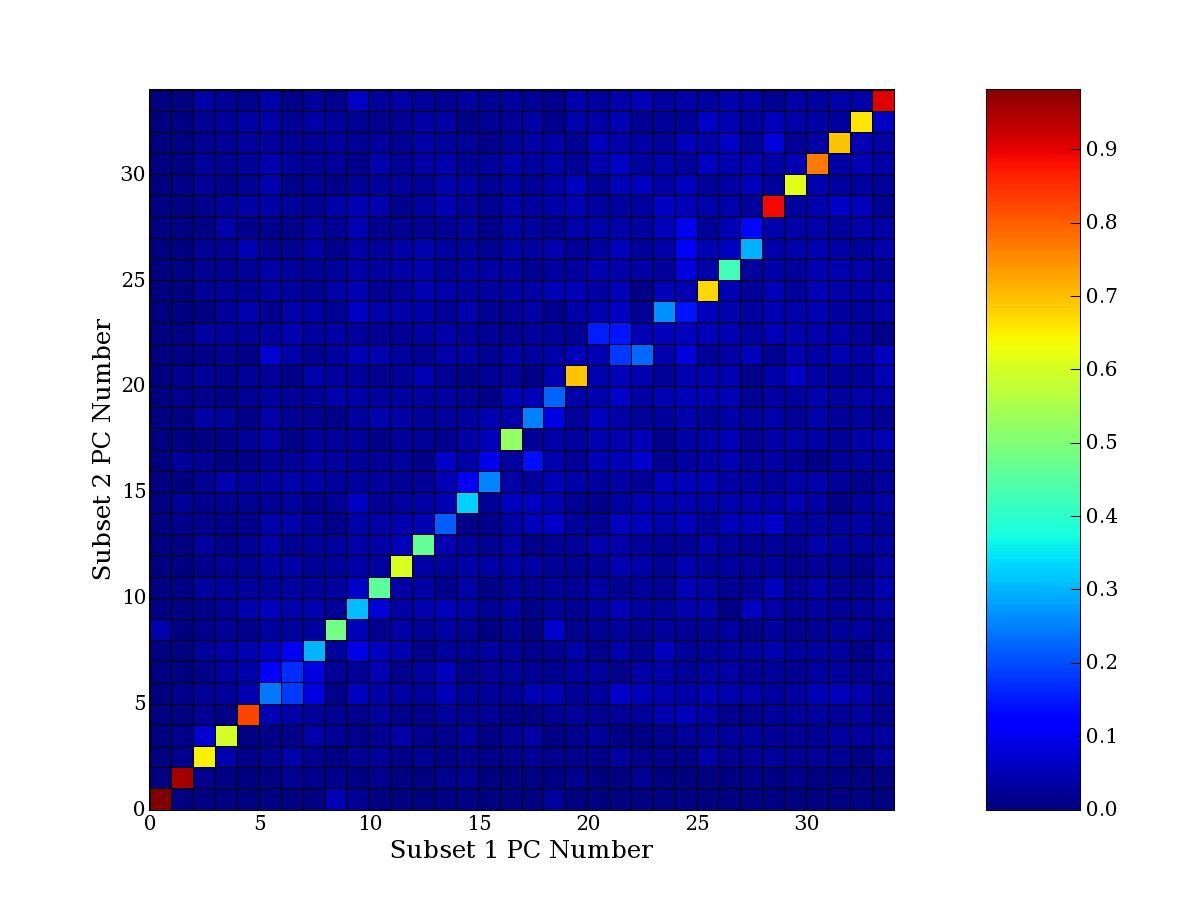
Each PCA interpretation analysis produces a set of high and low
principal component extreme genes (PCEGs). One such analysis can be
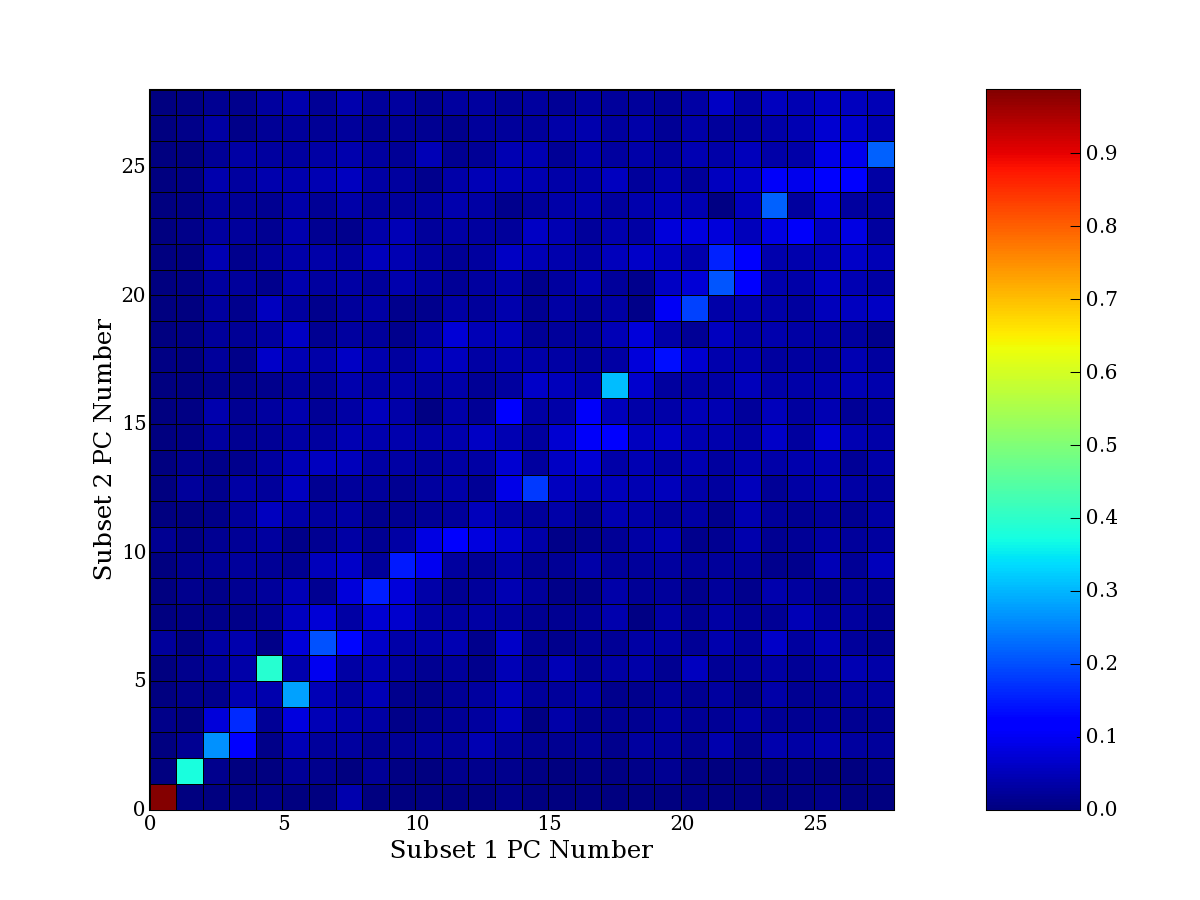
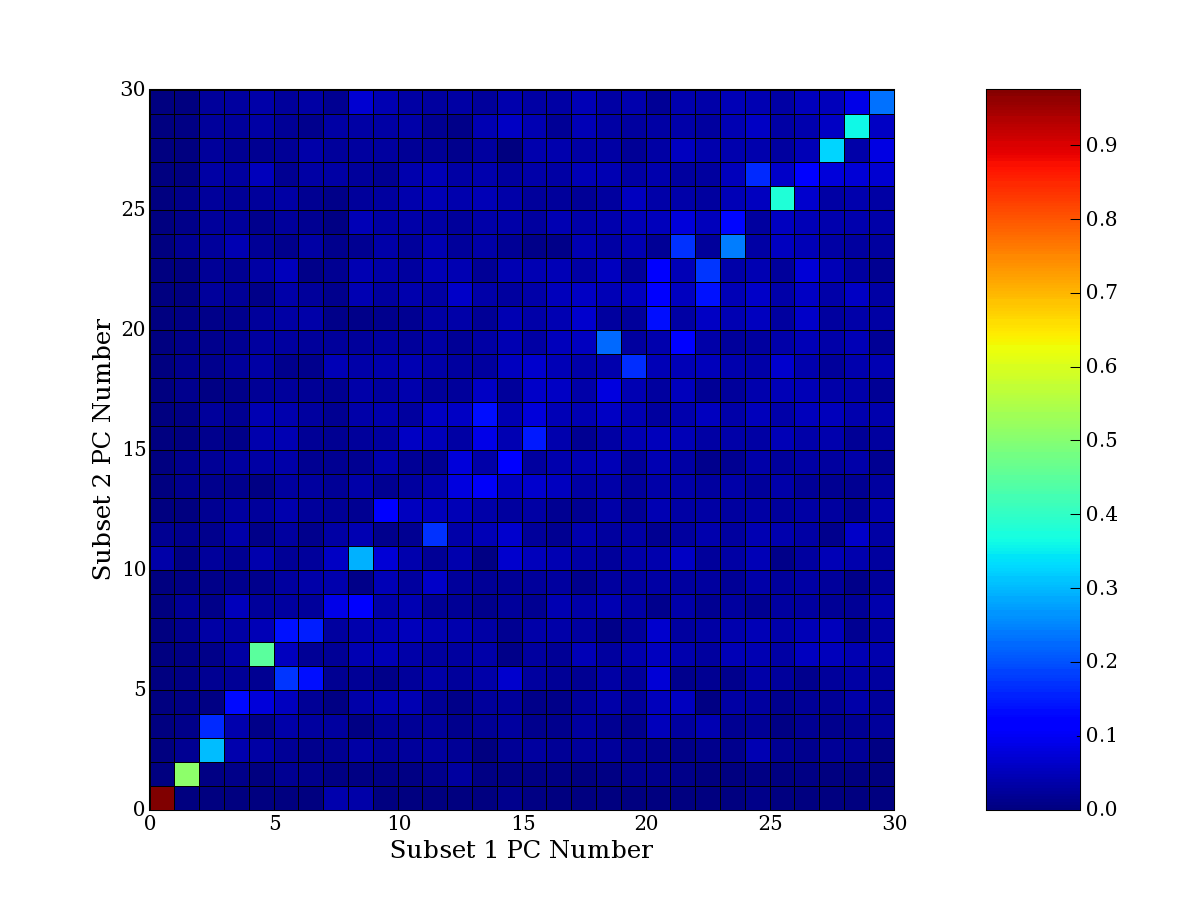
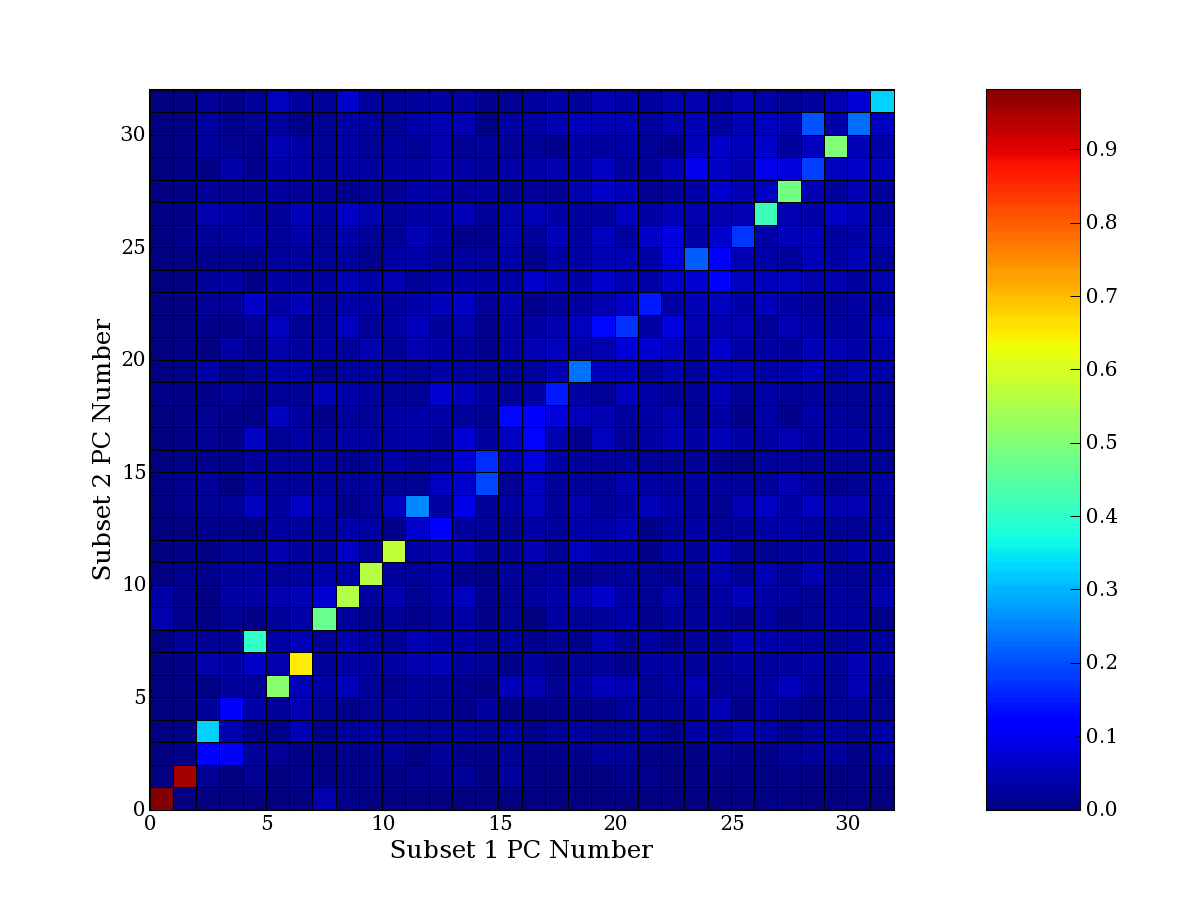
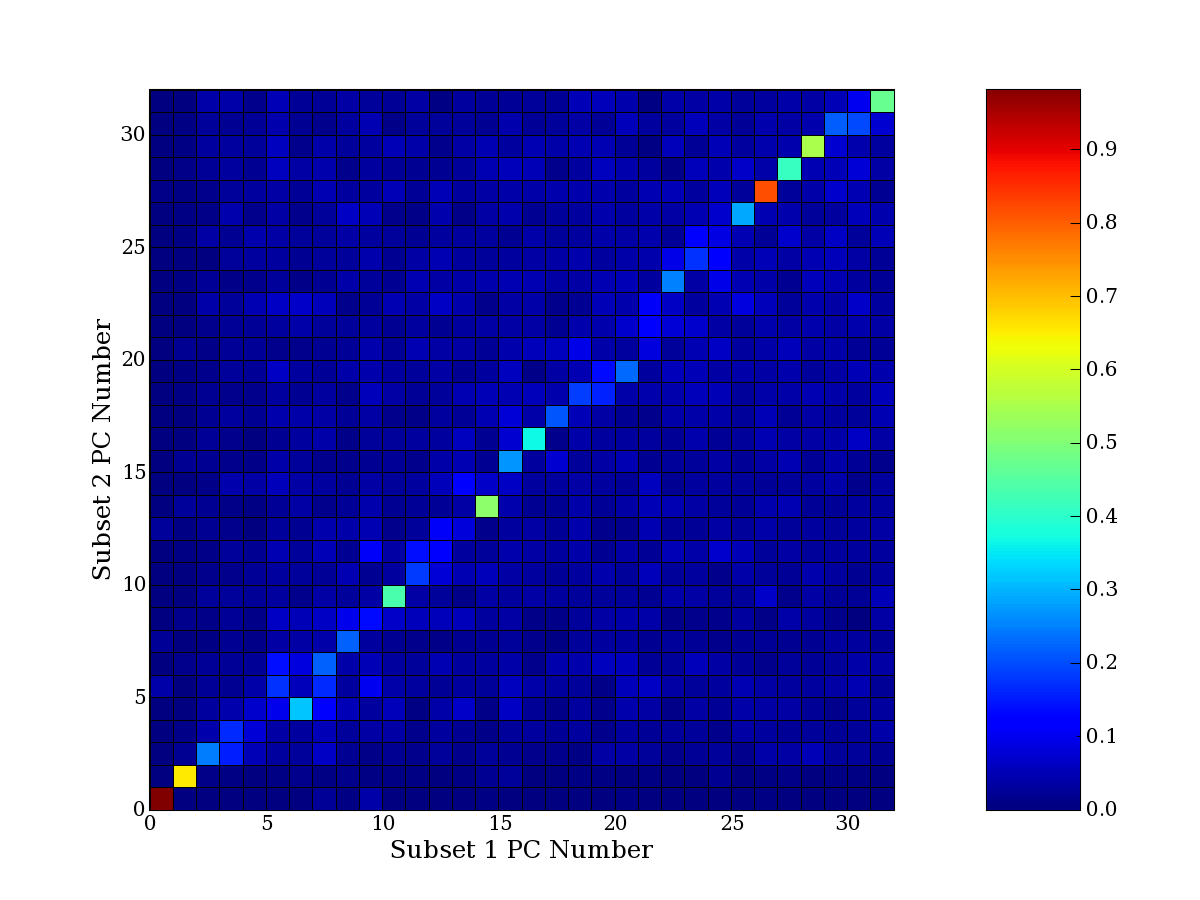
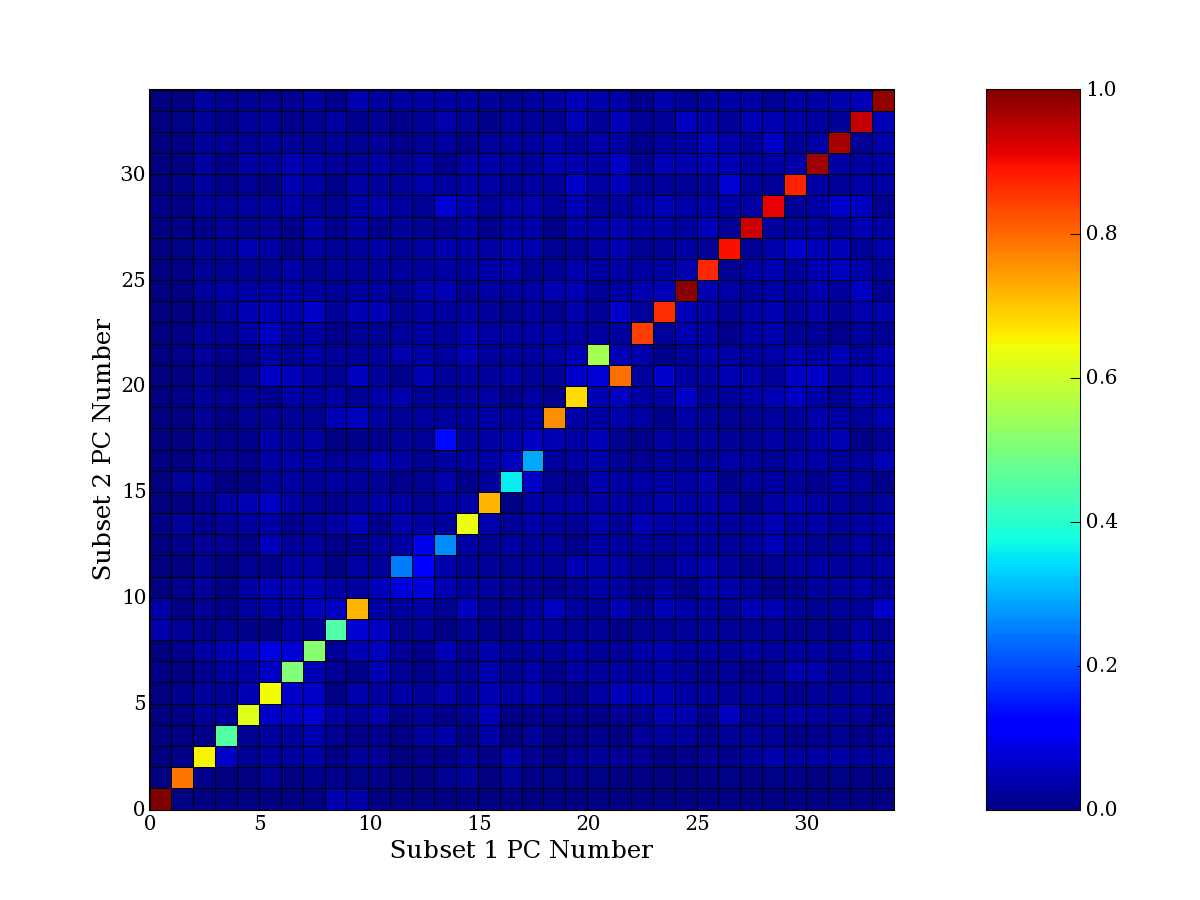
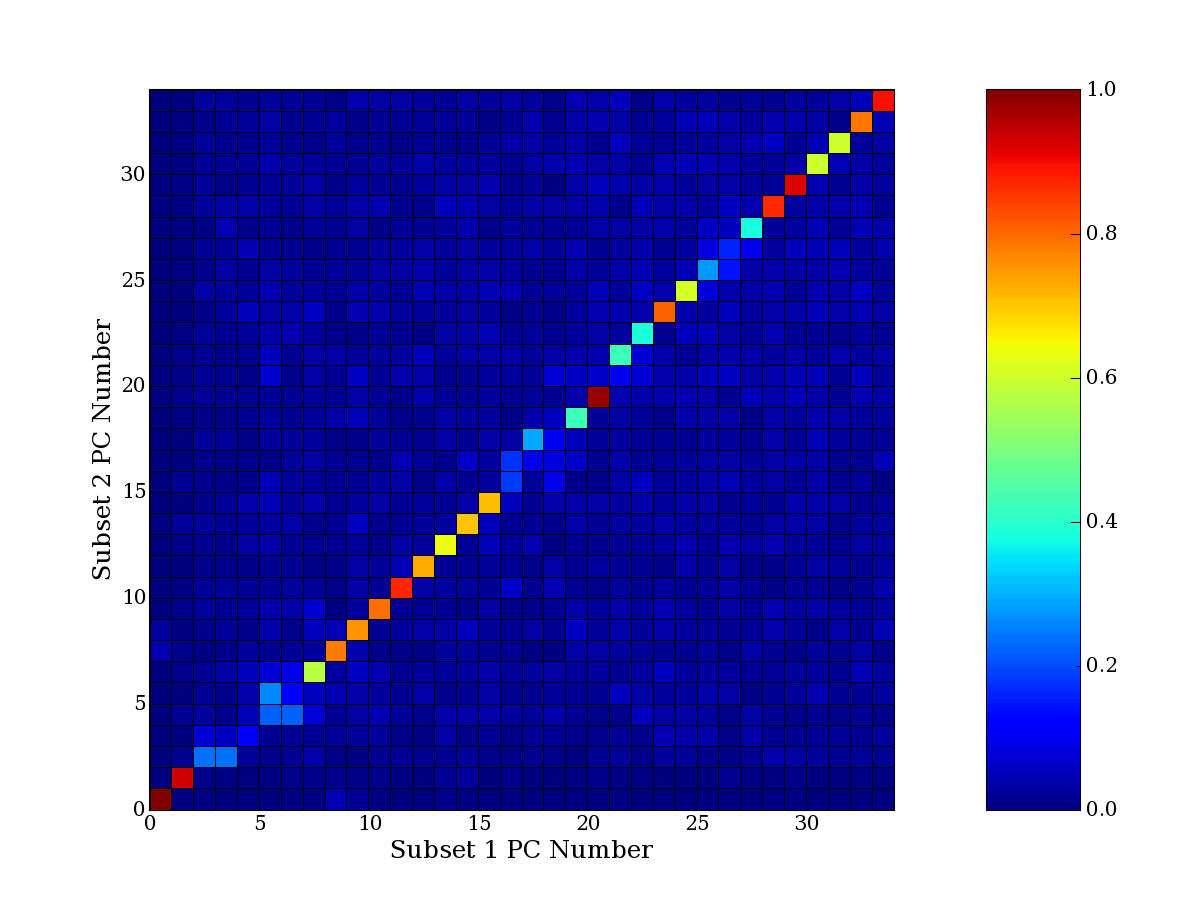
compared to another by forming a PCEG confusion matrix showing the
correspondence of every principal component from one data set (e.g.
the original data) vs. every principal component of a noise added
dataset. Each cell of the confusion matrix represents the fraction of
genes that intersect between the corresponding PCEG sets (the count of
intersecting PCEG genes divided by the count union of PCEG genes). A
single "PCEG overlap" score is calculated as the average of all row
maximums and all column maximums. If two analysis correspond well the
PCEG confusion matrix will have a strong diagonal component with
diagonal cell values near 1, and thus will get a PCEG overlap score
near 1. Scores greater than zero indicate that there is partial
overlap, possibly off-diagonal correspondence, between genes in
respective PCEG sets. We observe that some fraction of the principal
component gene sets are recovered in spite of additional noise or
in spite of selecting different column subsets.
The following directory contains one PCEG comparison confusion matrix
per experiment run. The figures themselves do not have titles, but
their directory name and file name indicate the experiment settings
used to generate each dataset. E.g.:
noise-added-0.01/noise-0.050-run-3-intersect.png
indicates this is a noise added experiment at extremeThresh=0.01,
at noise level 5%, and is experiment run number 3.
indicates this is a class-balanced column subset experiment at
extremeThresh=0.001, using diagnosis class subset size 15,
and is the output of experiment run number 5.