The following summary statistics are calculated by counting the number of reads that have the given characteristics.
| Sample | Note | Total Purity Filtered Reads Sequenced | Alternative Aligments | Failed Vendor QC Check | Read Length | Estimated Library Size |
|---|---|---|---|---|---|---|
| ExpoNoTrim | ExpoNoTrim | 31,474,960 | 19,917,382 | NA | 50 | NA |
Total Purity Filtered Reads Sequenced are filtered for vendor fail flags and exclude alternative alignment reads. Alternative Aligments are duplicate read entries providing alternative coordinates. Failed Vendor QC Check are reads which have been designated as failed by the sequencer. Read Length is the maximum length found for all reads. Estimated Library Size is the number of expected fragments based upon the total number of reads and duplication rate assuming a Poisson distribution.
| Sample | Note | Mapped | Mapping Rate | Mapped Unique | Mapped Unique Rate of Total | Unique Rate of Mapped | Duplication Rate of Mapped | Base Mismatch Rate | rRNA | rRNA rate |
|---|---|---|---|---|---|---|---|---|---|---|
| ExpoNoTrim | ExpoNoTrim | 31,474,960 | 1.000 | 31,474,960 | 1.000 | 1.000 | NA | 0.006 | NA | NA |
Mapped reads are those that were aligned. Mapping Rate is per total reads. Mapped Unique are both aligned as well as non-duplicate reads. Mapped Unique Rate of Total is per total reads. Unique Rate of Mapped are unique reads divided by all mapped reads. Duplication Rate of Mapped is the duplicate read divided by total mapped reads. Base Mismatch Rate is the number of bases not matching the reference divided by the total number of aligned bases. rRNA reads are non-duplicate and duplicate reads aligning to rRNA regions as defined in the transcript model definition. rRNA Rate is per total reads.
| Sample | Note | Mapped Pairs | Unpaired Reads | End 1 Mapping Rate | End 2 Mapping Rate | End 1 Mismatch Rate | End 2 Mismatch Rate | Fragment Length Mean | Fragment Length StdDev | Chimeric Pairs |
|---|---|---|---|---|---|---|---|---|---|---|
| ExpoNoTrim | ExpoNoTrim | NA | 31,474,960 | NA | NA | NA | NA | NA | NA | NA |
Mapped Pairs is the total number of pairs for which both ends map. Unpaired Reads are the number of reads that are lacking a mate. End 1/2 Mapping Rate is the number of mapped divided by the total number of End1/End2 reads. End 1/2 Mismatch Rate is the number of End 1 and 2 bases not matching the reference divided by the total number of mapped End 1 and 2 bases. Fragment Length Mean/StdDev is the mean distance, standard deviation between the start of an upstream read and the end of the downstream one. Only fragments contained within single exons are used. Chimeric Pairs are pairs whose mates map to different genes.
| Sample | Note | Intragenic Rate | Exonic Rate | Intronic Rate | Intergenic Rate | Split Reads | Expression Profiling Efficiency | Transcripts Detected | Genes Detected |
|---|---|---|---|---|---|---|---|---|---|
| ExpoNoTrim | ExpoNoTrim | 0.206 | 0.196 | 0.009 | 0.794 | 313,408 | 0.196 | 50,876 | 14,060 |
All of the above rates are per mapped read. Intragenic Rate refers to the fraction of reads that map within genes (within introns or exons). Exonic Rate is the fraction mapping within exons. Intronic Rate is the fraction mapping within introns. Intergenic Rate is the fraction mapping in the genomic space between genes. Split Reads is the number of reads spanning an exon exon junction. Expression Profile Efficiency is the ratio of exon reads to total reads. Transcripts/Genes Detected is the number of transcripts/Genes with at least 5 reads.
| Sample | Note | End 1 Sense | End 1 Antisense | End 2 Sense | End 2 Antisense | End 1 % Sense | End 2 % Sense |
|---|---|---|---|---|---|---|---|
| ExpoNoTrim | ExpoNoTrim | NA | NA | NA | NA | NA | NA |
End 1/2 Sense are the number of End 1 or 2 reads that were sequenced in the sense direction. Similarly, End 1/2 Antisense are the number of End 1 or 2 reads that were sequenced in the antisense direction.End 1/2 Sense % are percentages of intragenic End 1/2 reads that were sequenced in the sense direction.
The metrics in this table are calculated across the transcripts that were determined to have the highest expression levels.
| Sample | Note | Mean Per Base Cov. | Mean CV | No. Covered 5' | 5'200Base Norm | No. Covered 3' | 3' 200Base Norm | Num. Gaps | Cumul. Gap Length | Gap % |
|---|---|---|---|---|---|---|---|---|---|---|
| ExpoNoTrim | ExpoNoTrim | 0.48 | 1.69 | 173 | 0.37 | 143 | 0.452 | 11247 | 1452918 | 67.9 |
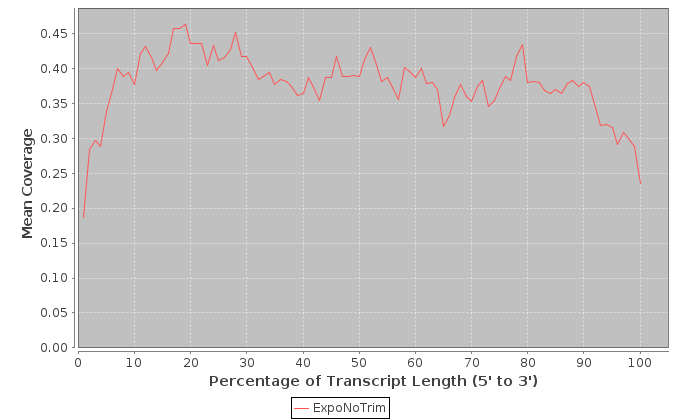
It is important to note that these values are restricted to the bottom 1000 expressed transcripts. 5' and 3' values are per-base coverage averaged across all top transcripts. 5' and 3' ends are 200 base pairs. Gap % is the total cumulative gap length divided by the total cumulative transcript lengths.
The metrics in this table are calculated across the transcripts that were determined to have the highest expression levels.
| Sample | Note | Mean Per Base Cov. | Mean CV | No. Covered 5' | 5'200Base Norm | No. Covered 3' | 3' 200Base Norm | Num. Gaps | Cumul. Gap Length | Gap % |
|---|---|---|---|---|---|---|---|---|---|---|
| ExpoNoTrim | ExpoNoTrim | 1.49 | 1.06 | 450 | 0.36 | 422 | 0.432 | 12174 | 690672 | 33.8 |
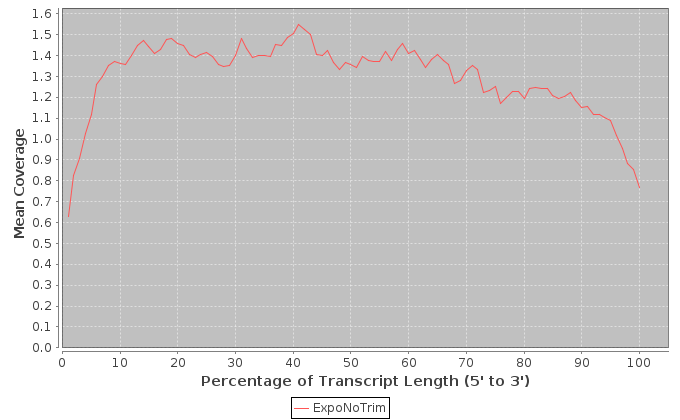
It is important to note that these values are restricted to the middle 1000 expressed transcripts. 5' and 3' values are per-base coverage averaged across all top transcripts. 5' and 3' ends are 200 base pairs. Gap % is the total cumulative gap length divided by the total cumulative transcript lengths.
The metrics in this table are calculated across the transcripts that were determined to have the highest expression levels.
| Sample | Note | Mean Per Base Cov. | Mean CV | No. Covered 5' | 5'200Base Norm | No. Covered 3' | 3' 200Base Norm | Num. Gaps | Cumul. Gap Length | Gap % |
|---|---|---|---|---|---|---|---|---|---|---|
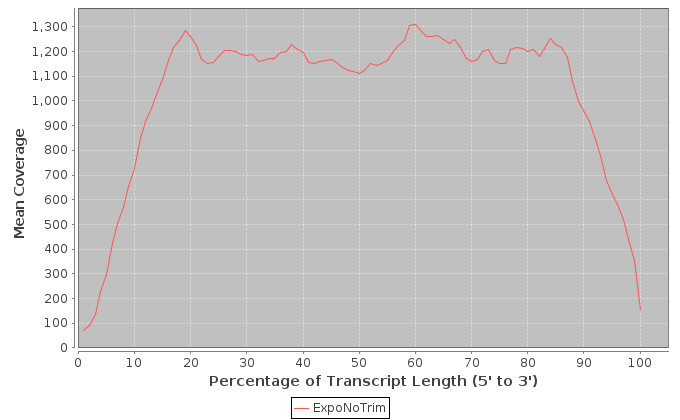
| ExpoNoTrim | ExpoNoTrim | 429.50 | 0.79 | 857 | 0.25 | 894 | 0.424 | 1182 | 78893 | 12.0 |
It is important to note that these values are restricted to the top 1000 expressed transcripts. 5' and 3' values are per-base coverage averaged across all top transcripts. 5' and 3' ends are 200 base pairs. Gap % is the total cumulative gap length divided by the total cumulative transcript lengths.
| File | Description |
|---|---|
| Metrics Tab Separated Value File | Text file containing all the metrics of the report in a single tab delimited file. |
| Mean Coverage Plot Data - Low Expr | Text file containing the data for mean coverage plot by position for low expression coverage |
| Mean Coverage Plot Data - Medium Expr | Text file containing the data for mean coverage plot by position for medium expression coverage |
| Mean Coverage Plot Data - High Expr | Text file containing the data for mean coverage plot by position for high expression coverage |
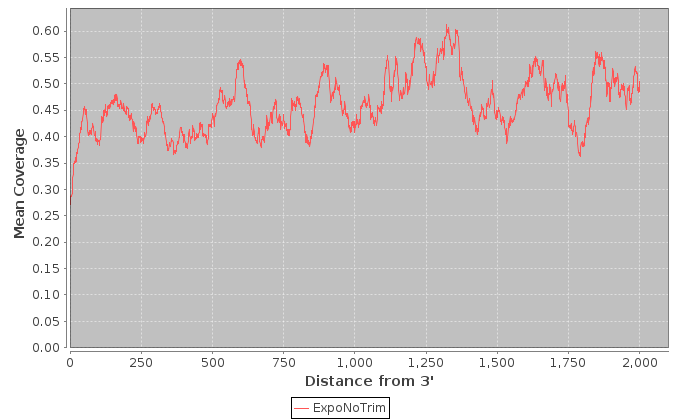
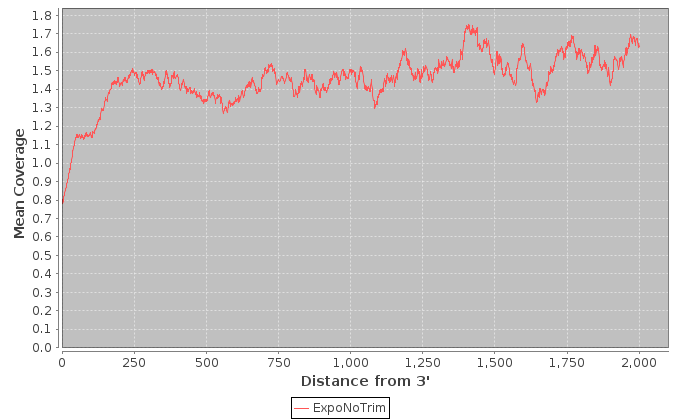
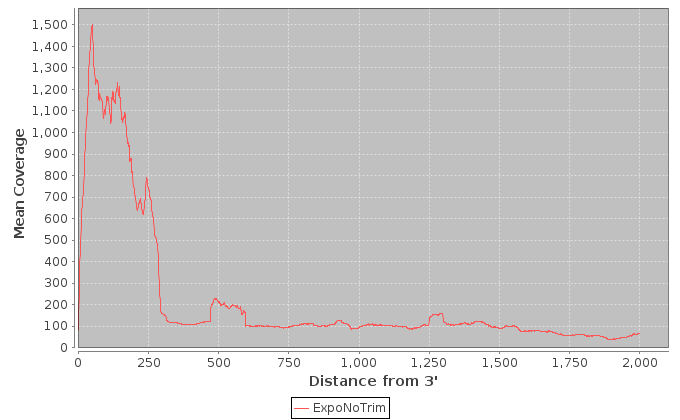
| Mean Coverage Plot Data - Low Expr | Text file containing the data for mean coverage plot by distance from 3' end for low expression coverage |
| Mean Coverage Plot Data - Medium Expr | Text file containing the data for mean coverage plot by distance from 3' end for medium expression coverage |
| Mean Coverage Plot Data - High Expr | Text file containing the data for mean coverage plot by distance from 3' end for high expression coverage |
| Mean Coverage Plot Data - Low Expr | Text file containing the data for gap length counts for low expression coverage |
| Mean Coverage Plot Data - Medium Expr | Text file containing the data for gap length counts for medium expression coverage |
| Mean Coverage Plot Data - High Expr | Text file containing the data for gap length counts for high expression coverage |
| Option | Description | Value |
|---|---|---|
| Samples | Samples/Sample File used | accepted_hits_gr_sort.bam|ExpoNoTrim |
| Transcript Model | GTF formatted file containing the transcript definitions | Mus_musculus.NCBIM37.67.filtered.gtf |
| Reference Genome | The genome version to which the BAM is aligned | mm9-single-cell-NIST-fixed-spikes.fa |
| Downsampling | For Coverage Metrics, the number of reads is randomly reduced to the given level | none |
| Detailed Report | The optional detailed report contains coverage metrics for every transcript | no details |
| rRNA Intervals | Genomic coordinates of rRNA loci | rRNA_intervals.list |