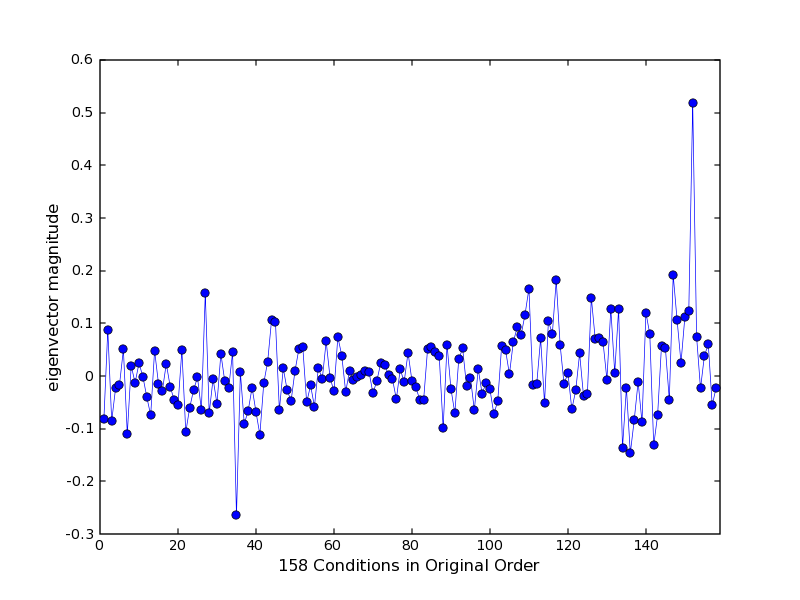
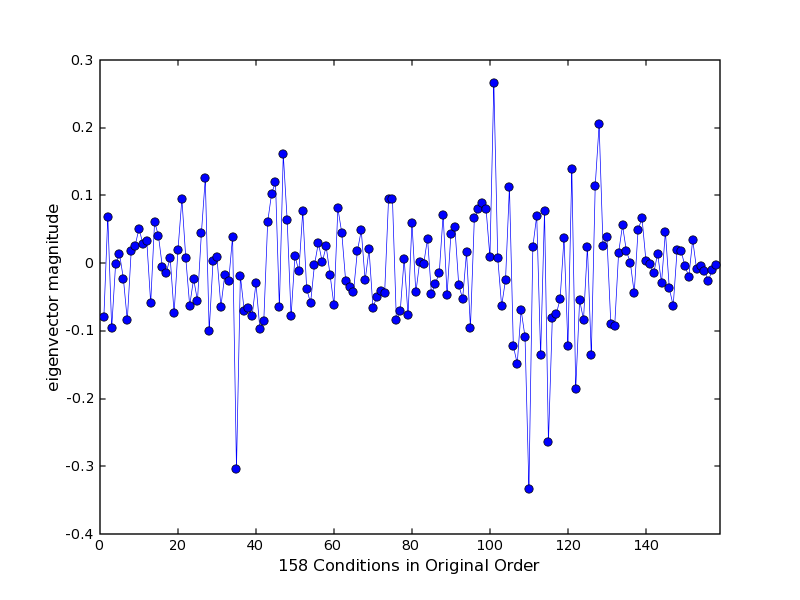
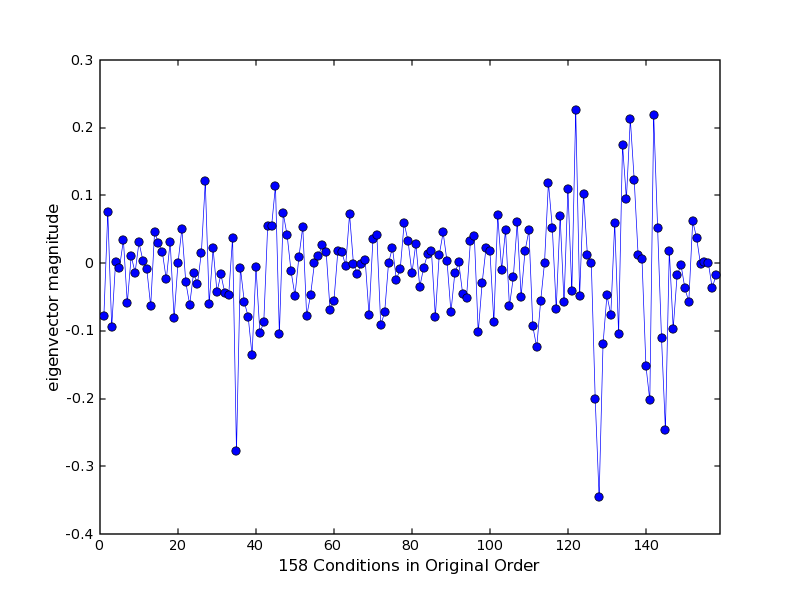
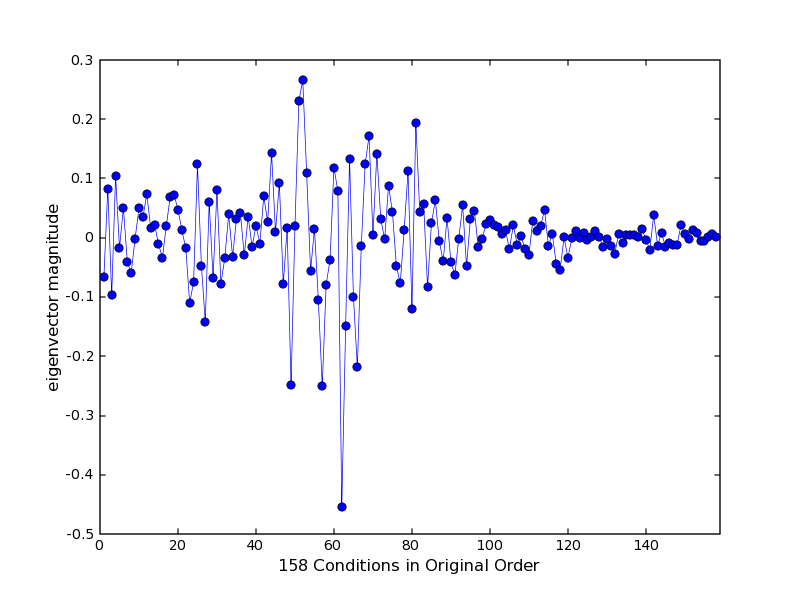
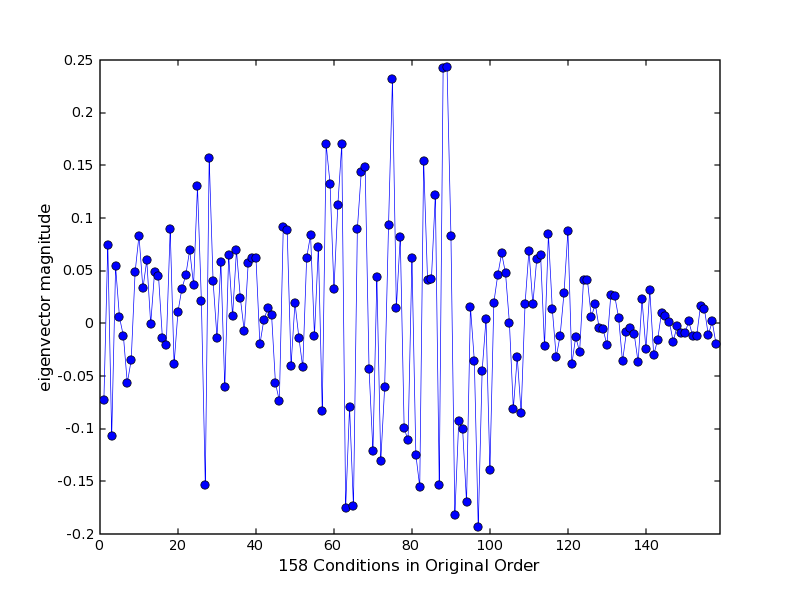
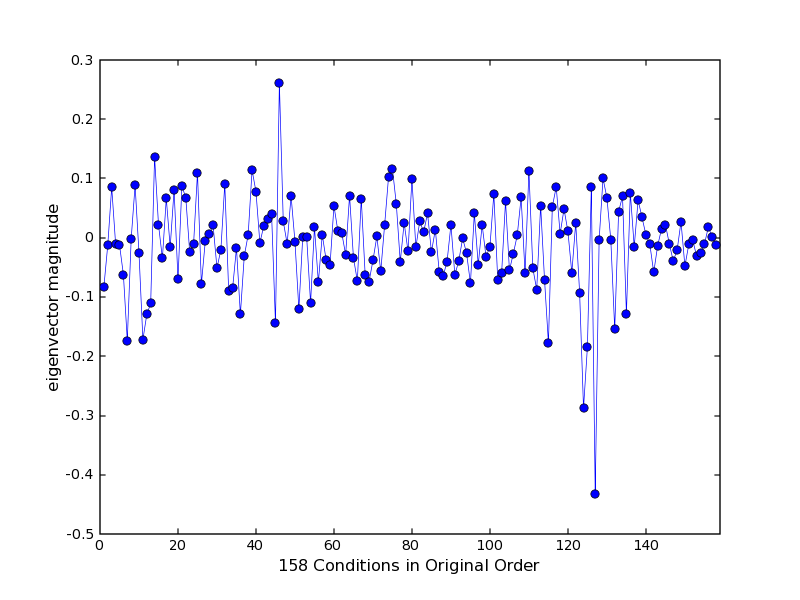
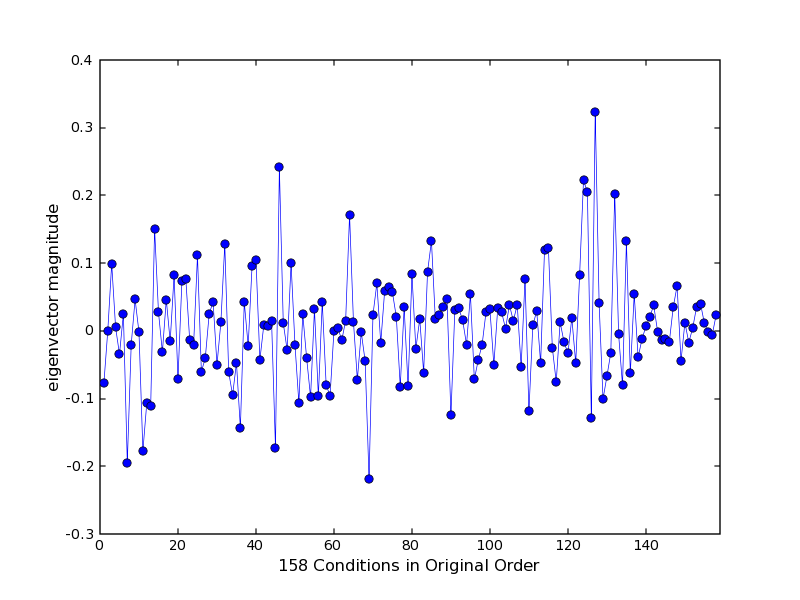
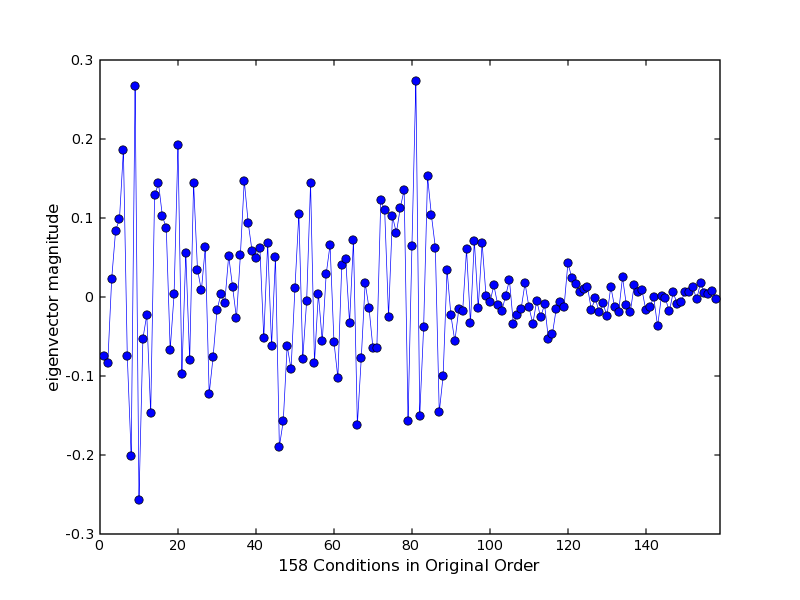
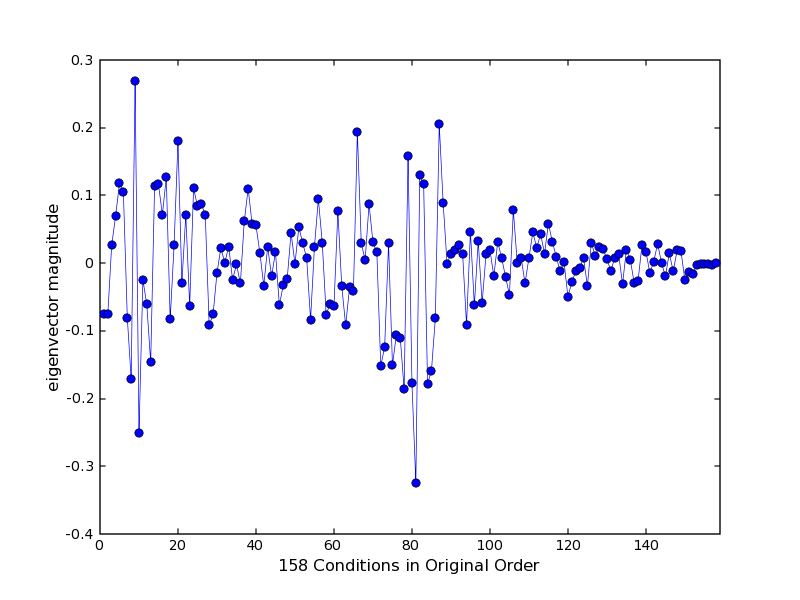
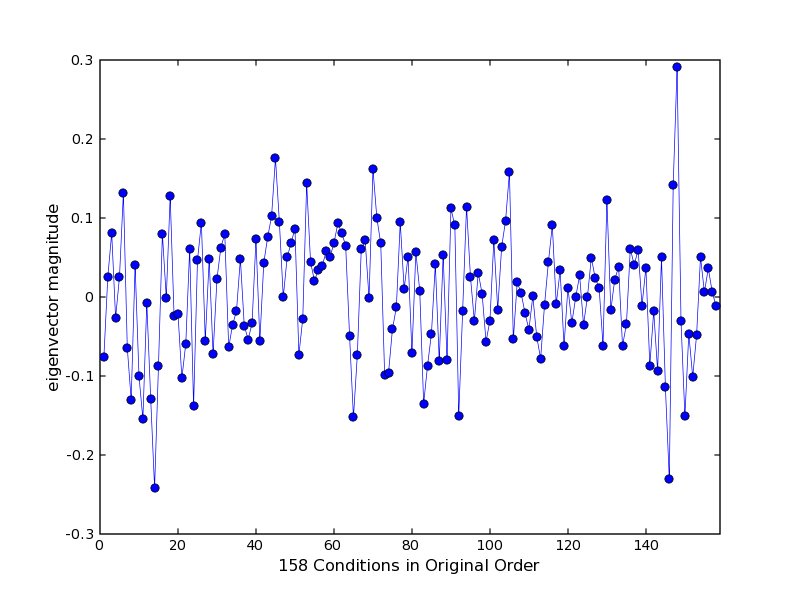
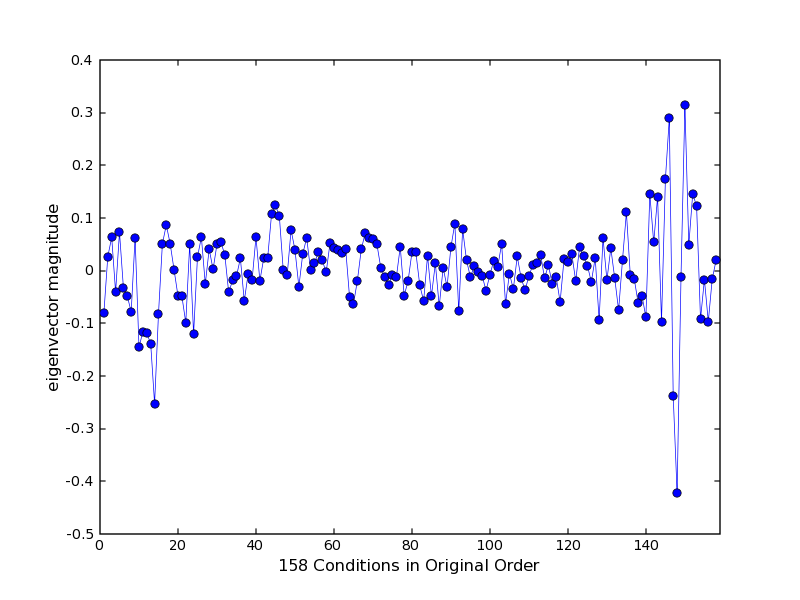
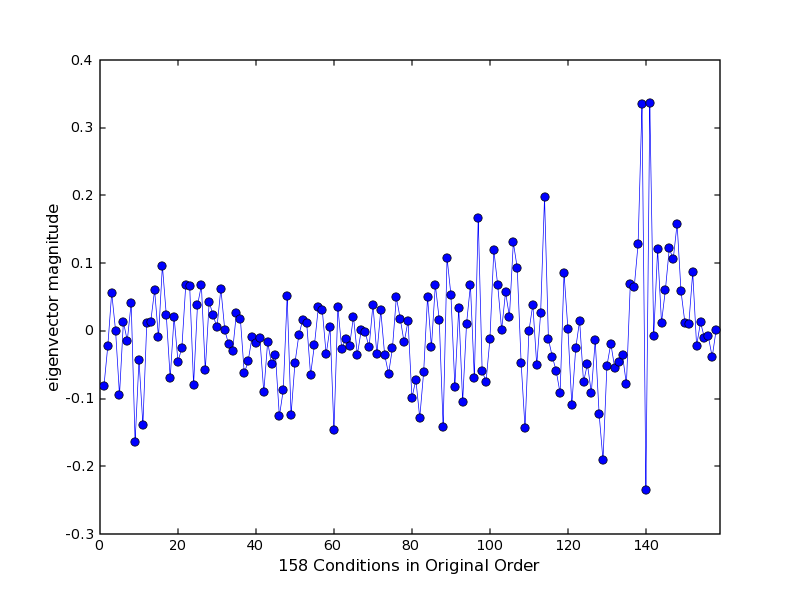
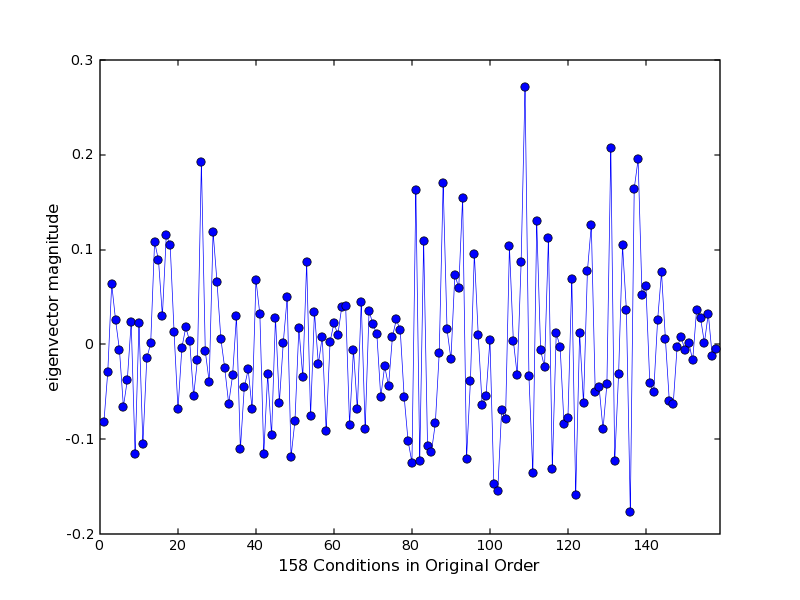
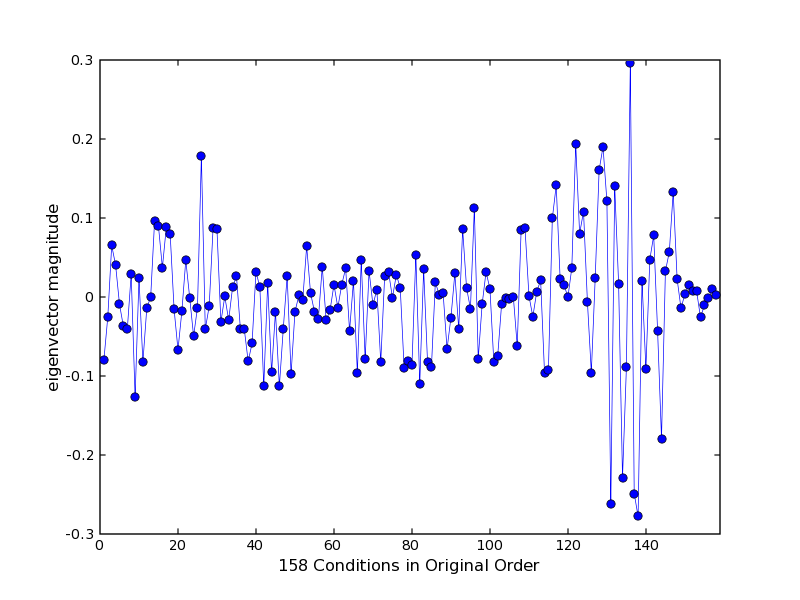
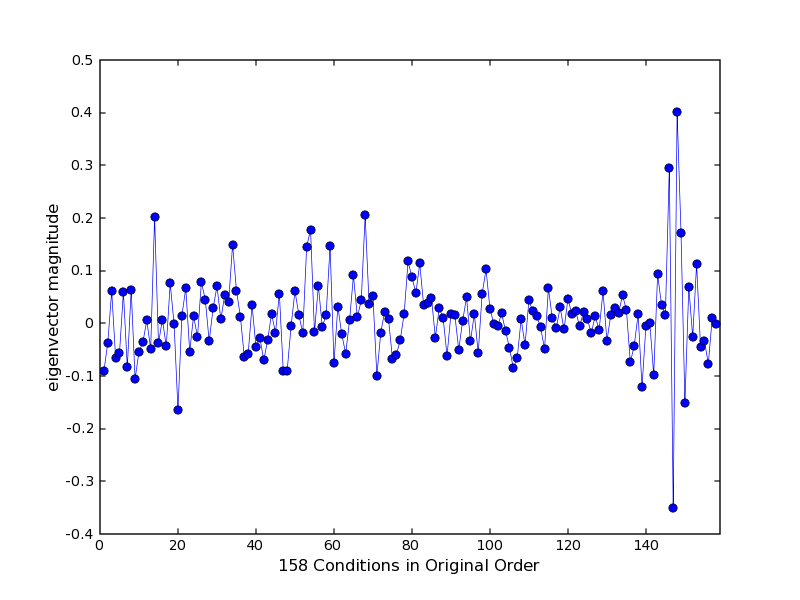
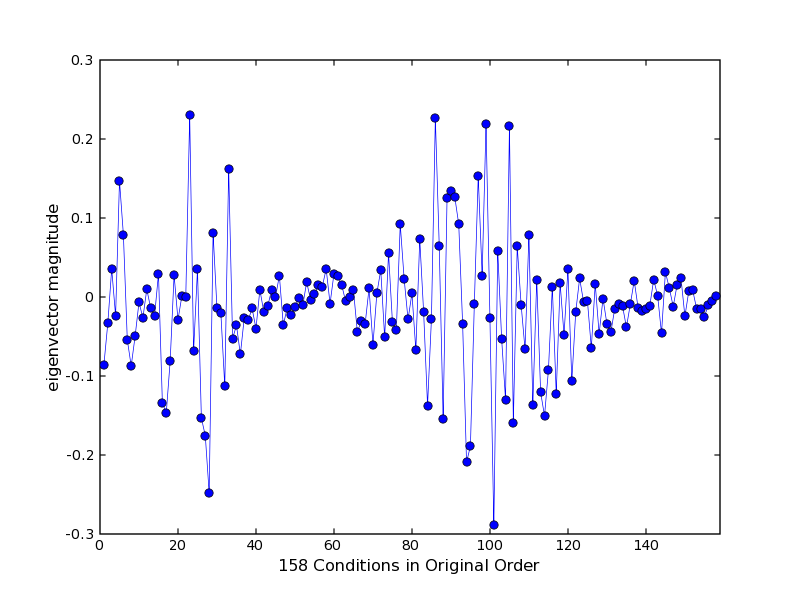
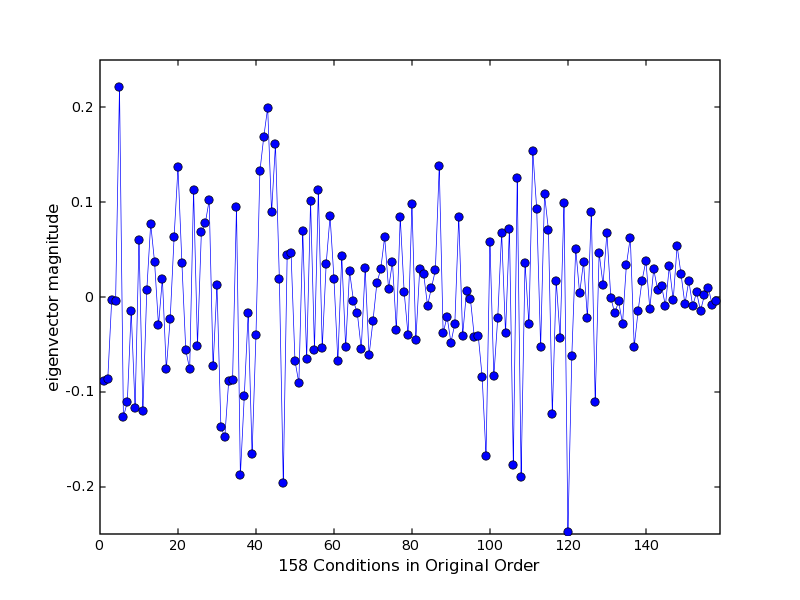
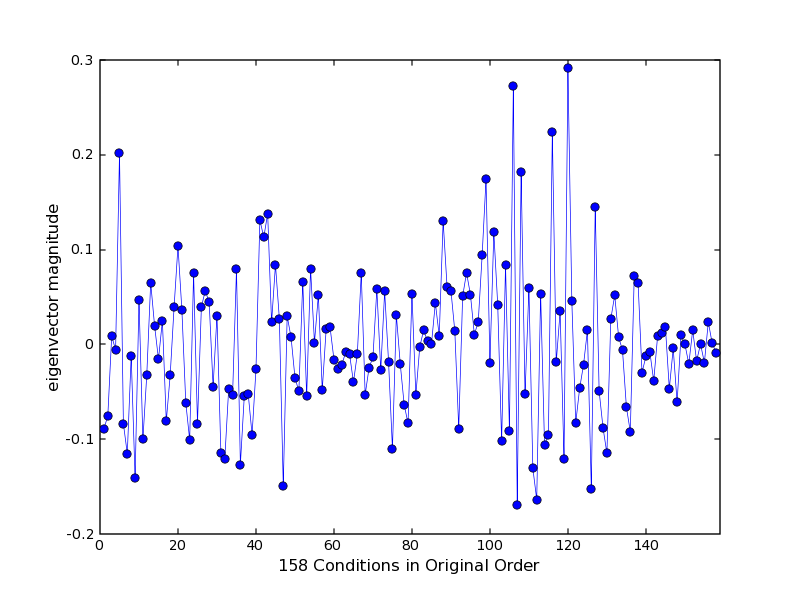
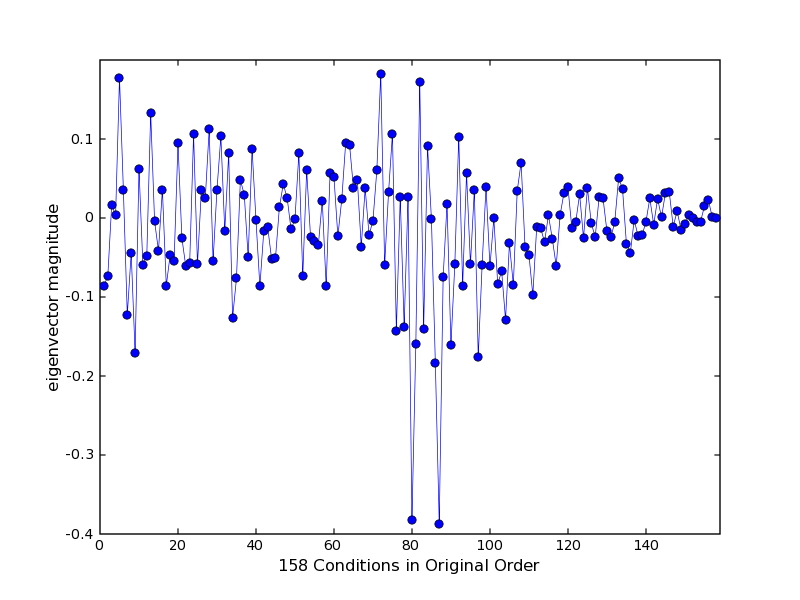
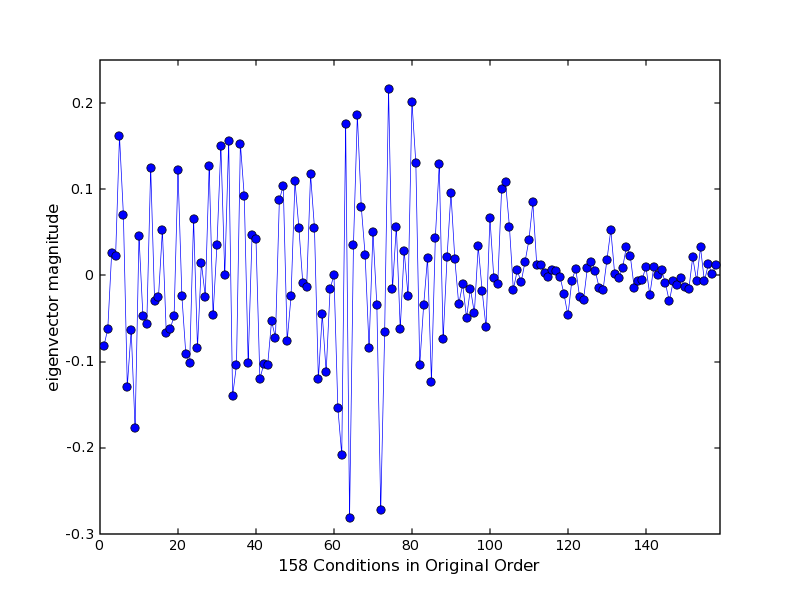
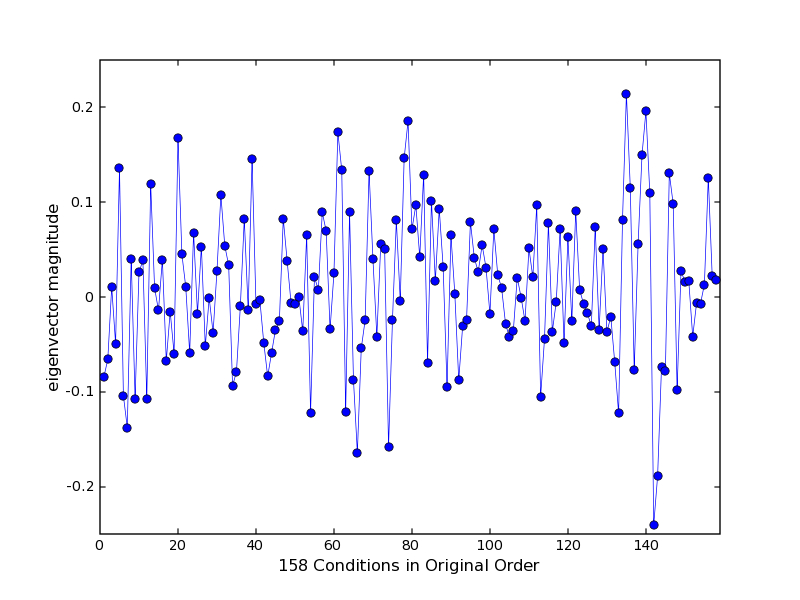
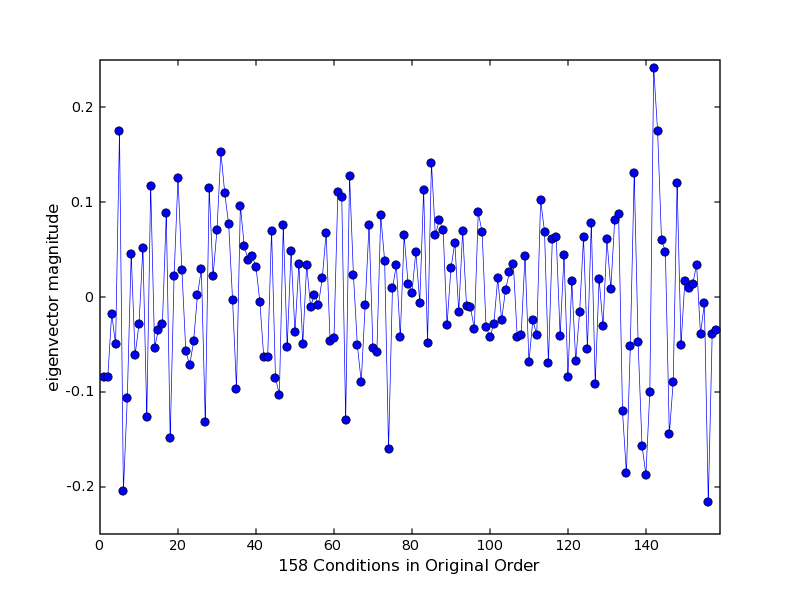
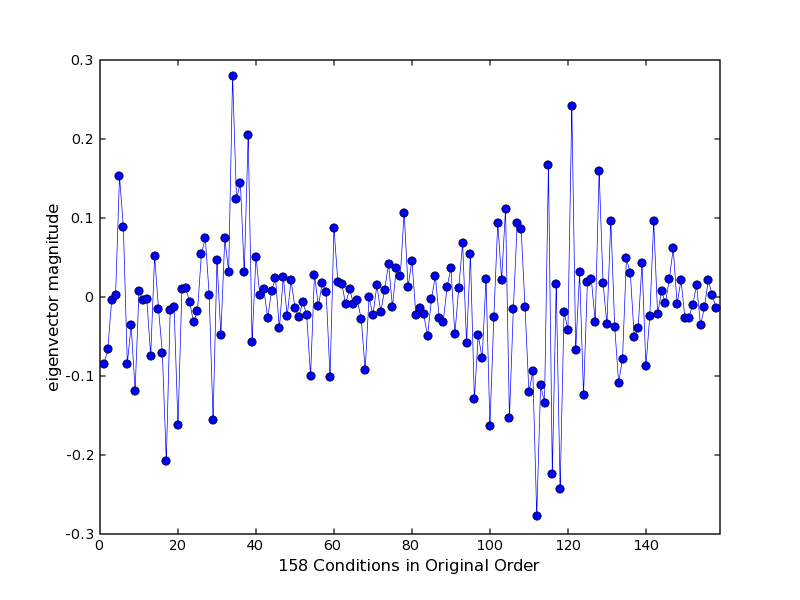
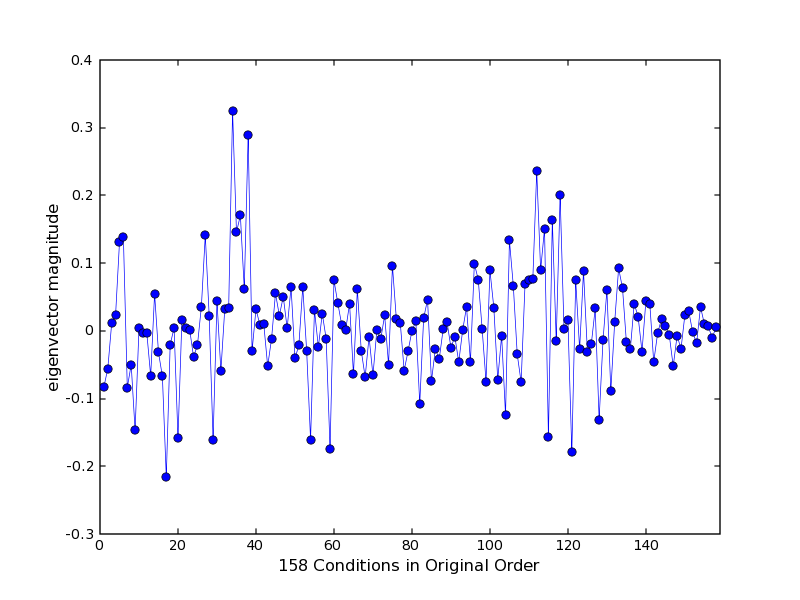
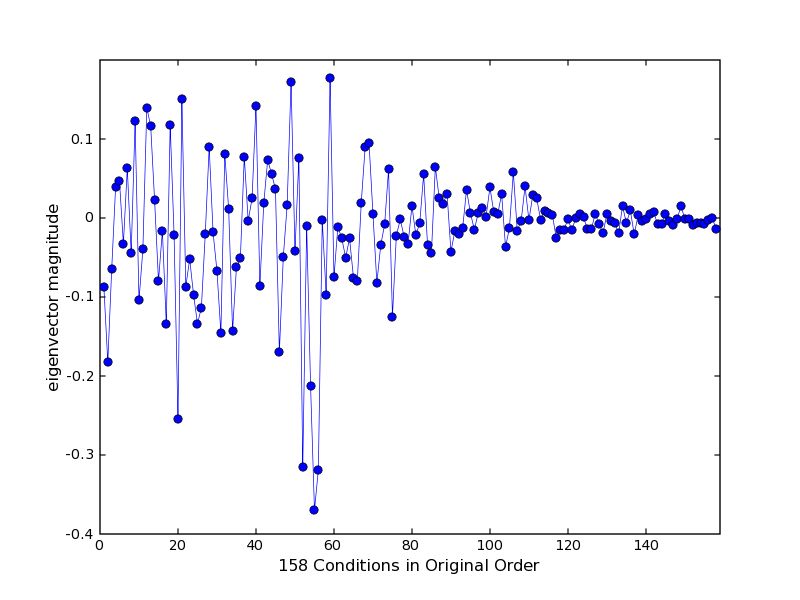
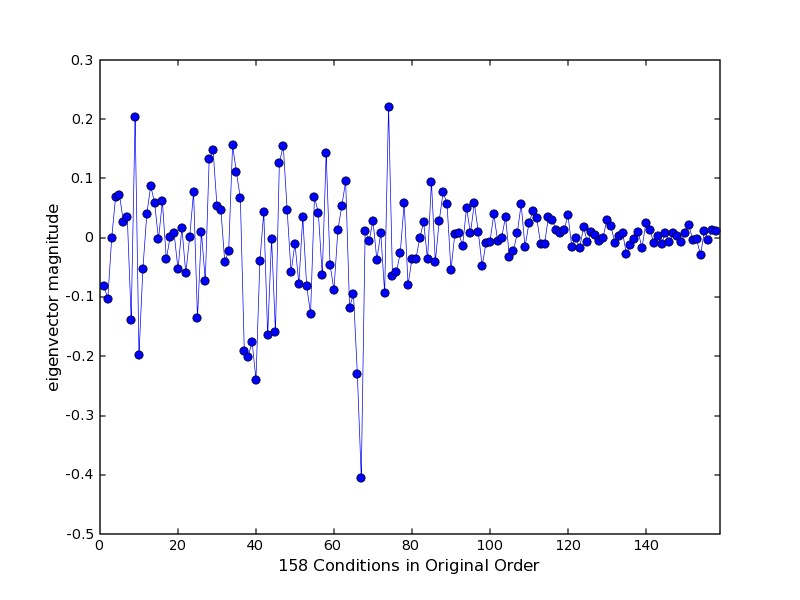
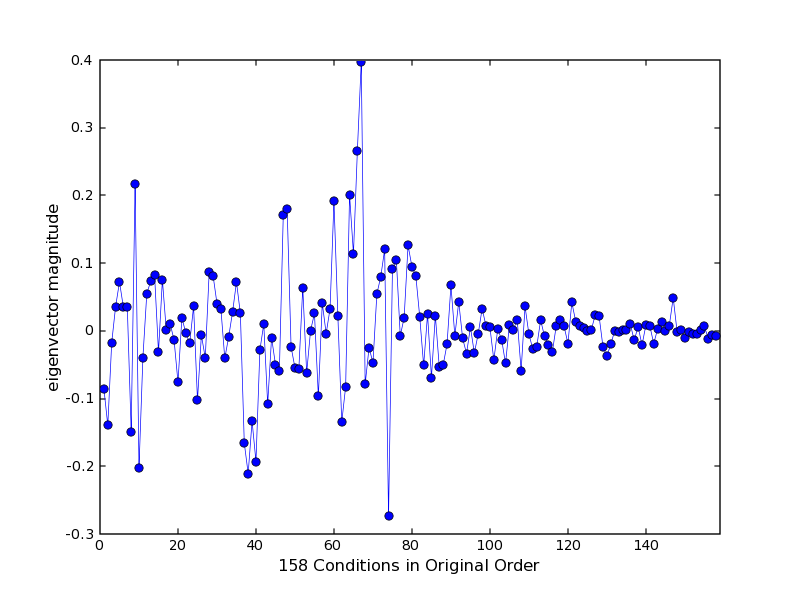
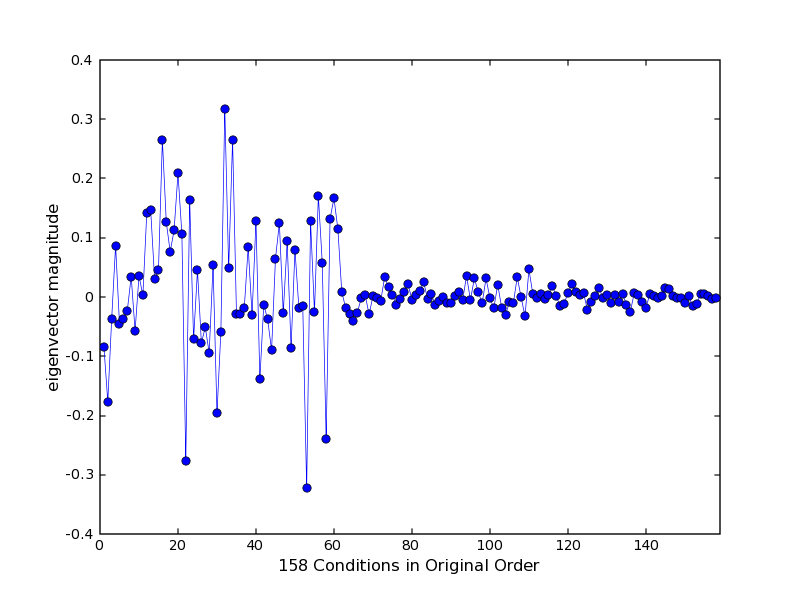
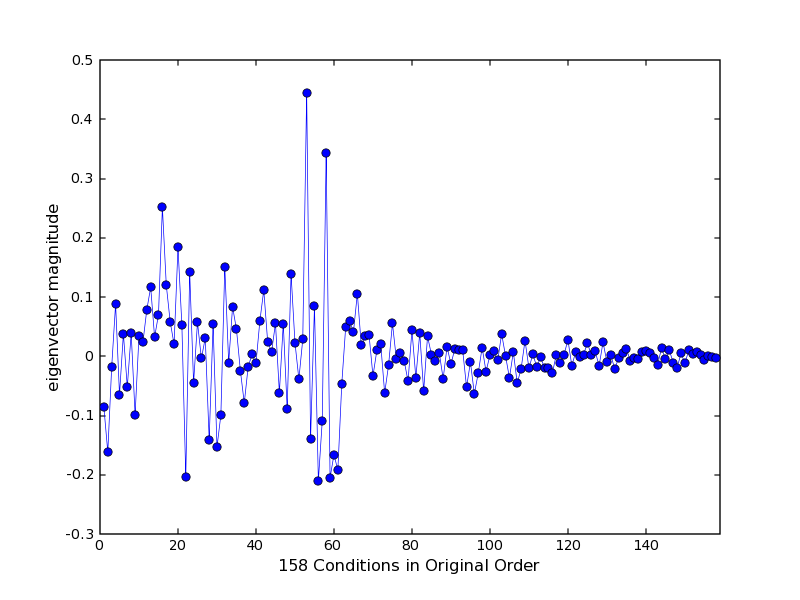
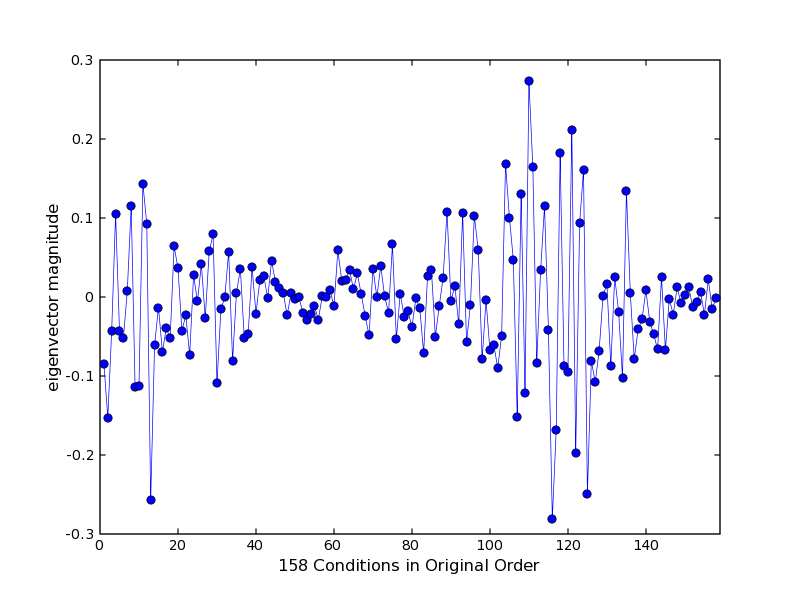
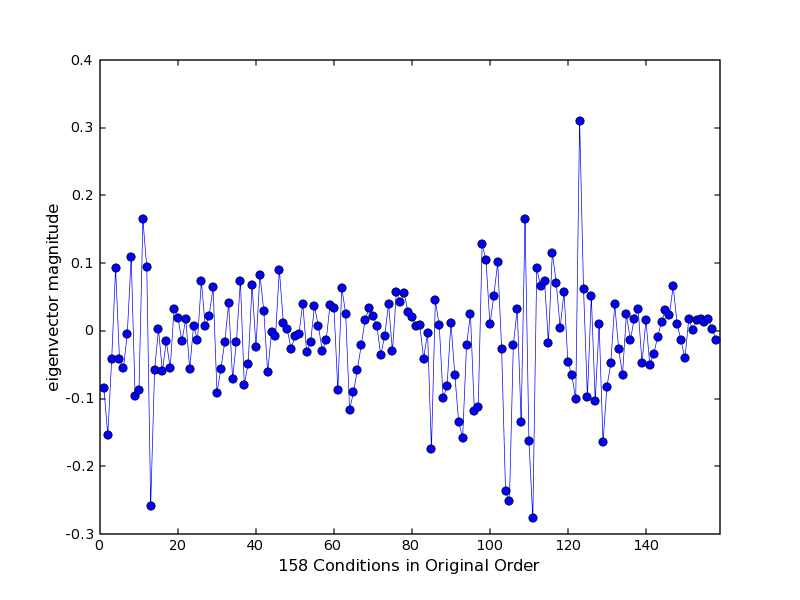
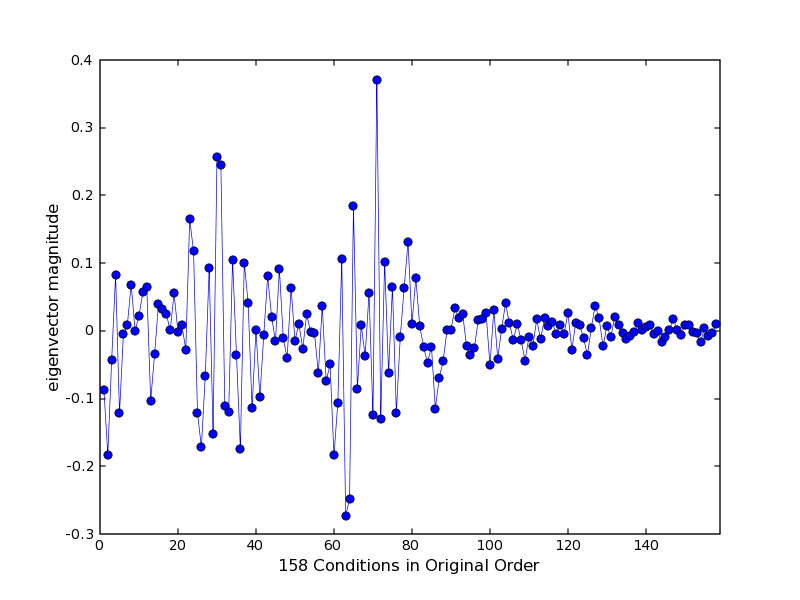
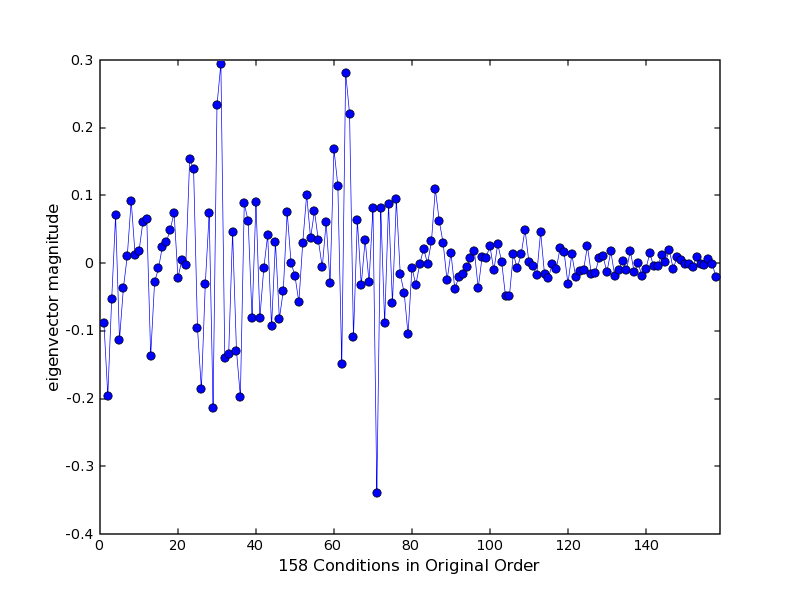
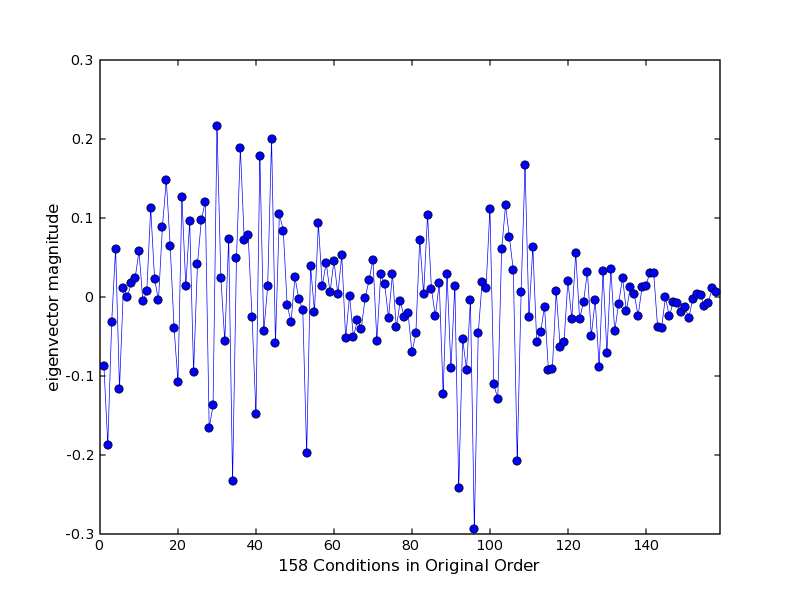
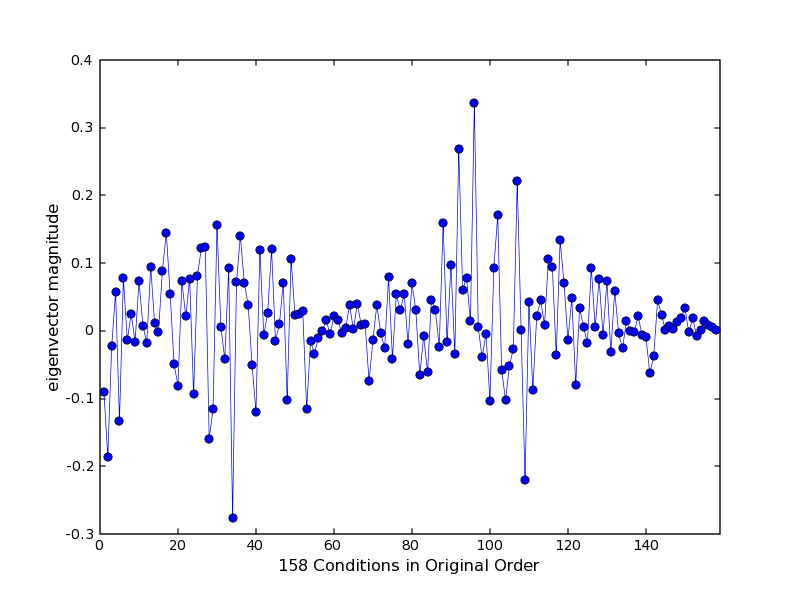
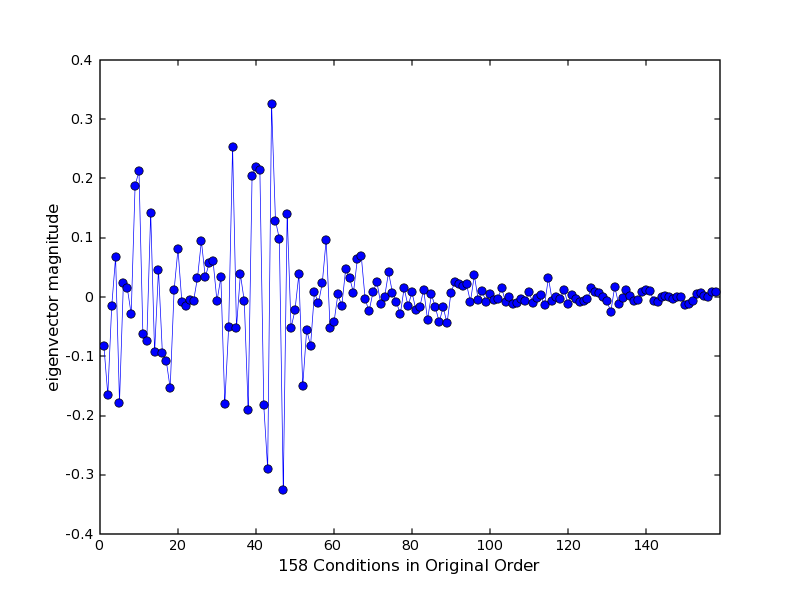
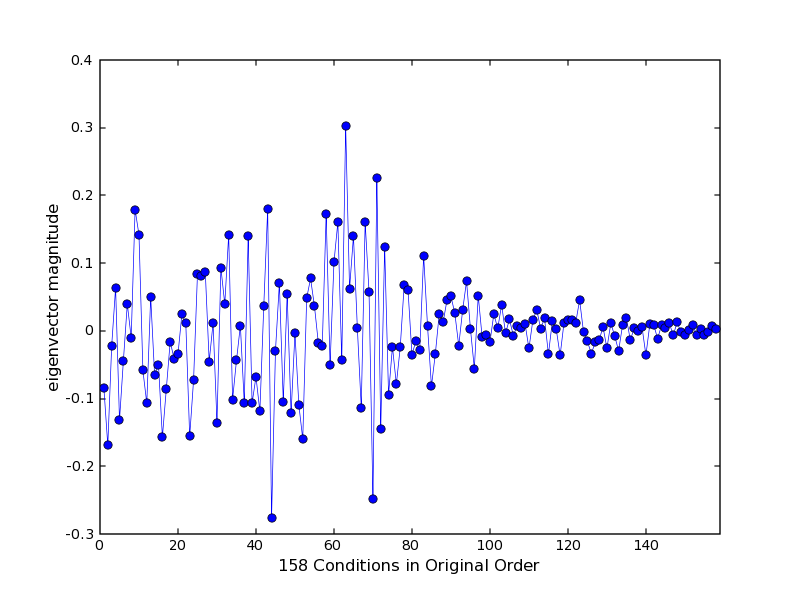
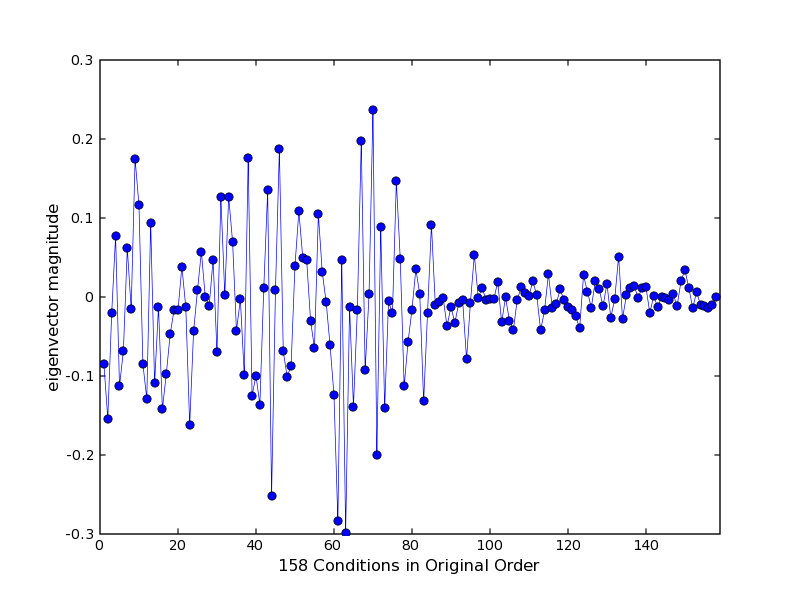
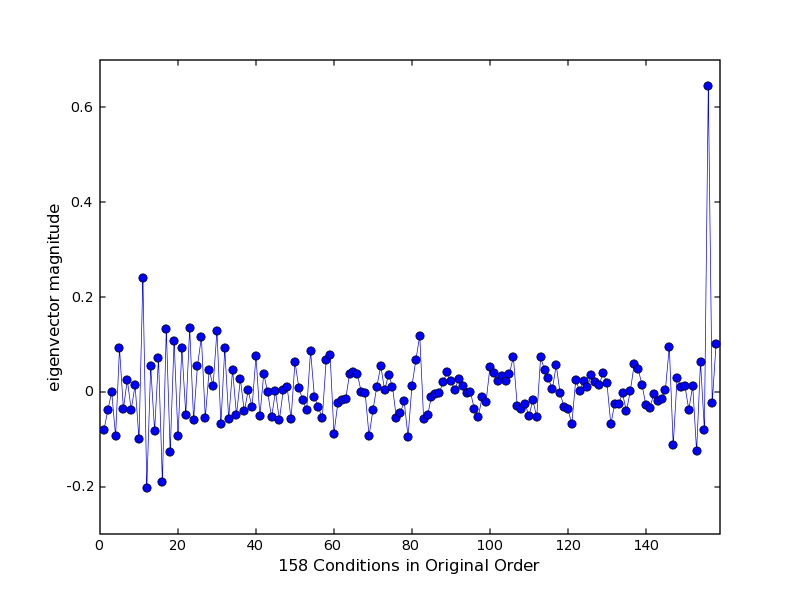
| pcNN-eigenvector.png | Tab-delimited text file listing the conditions that are up, flat and down for pcNN, ordered by decreasing difference of means. |
| pcNN-outliers.txt | Tab-delimited text file listing the genes that are high and low outliers for pcNN, including pcNN coefficient, and additional GNF gene annotations, including: ProbeId, Name, Aliases, Description, Function and Protein Families. |
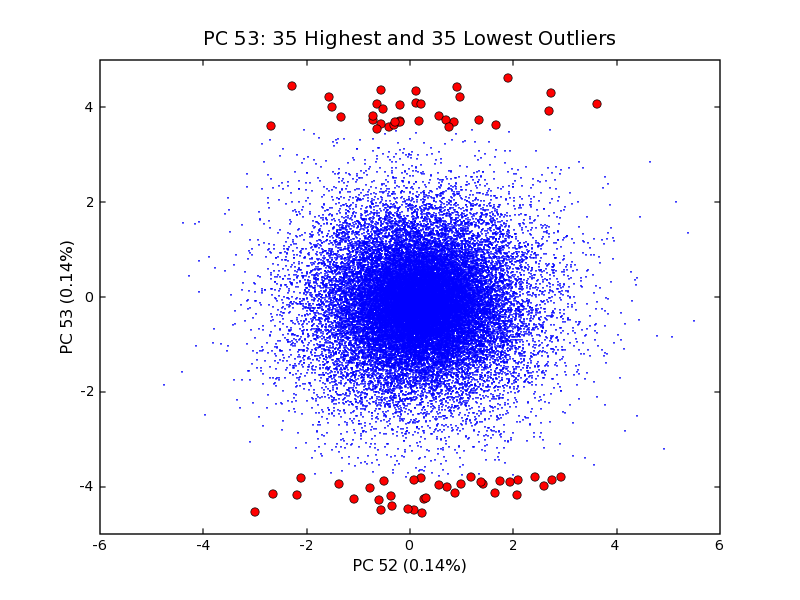
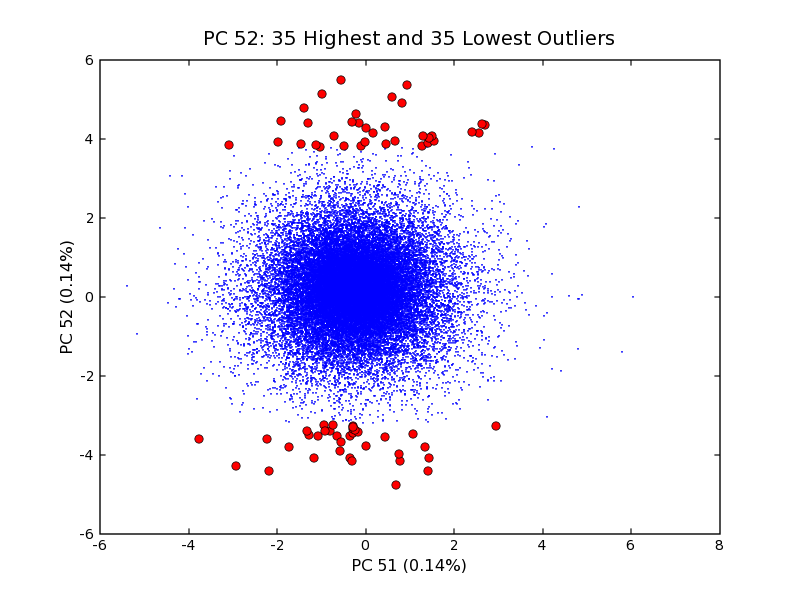
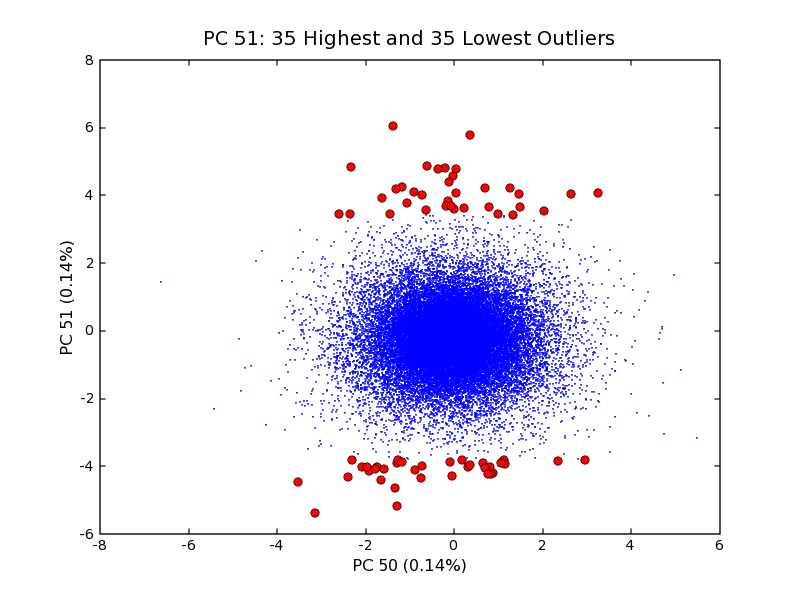
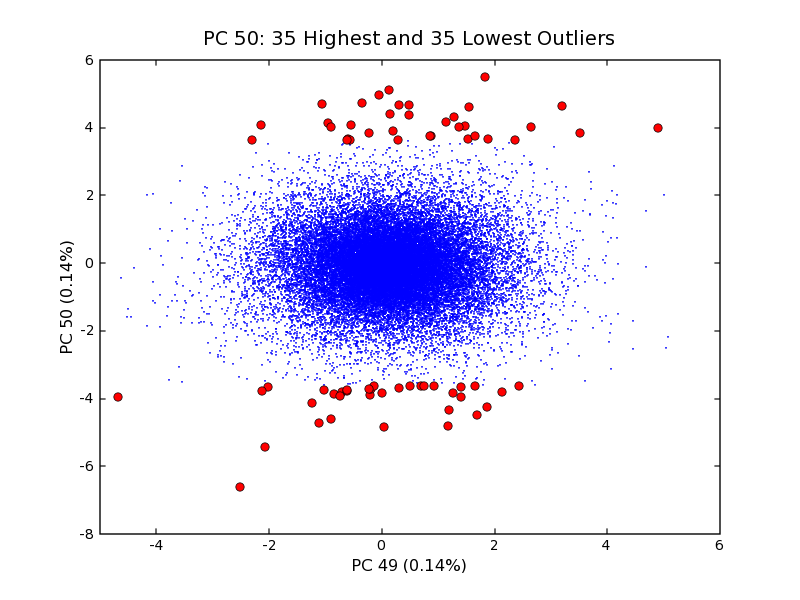
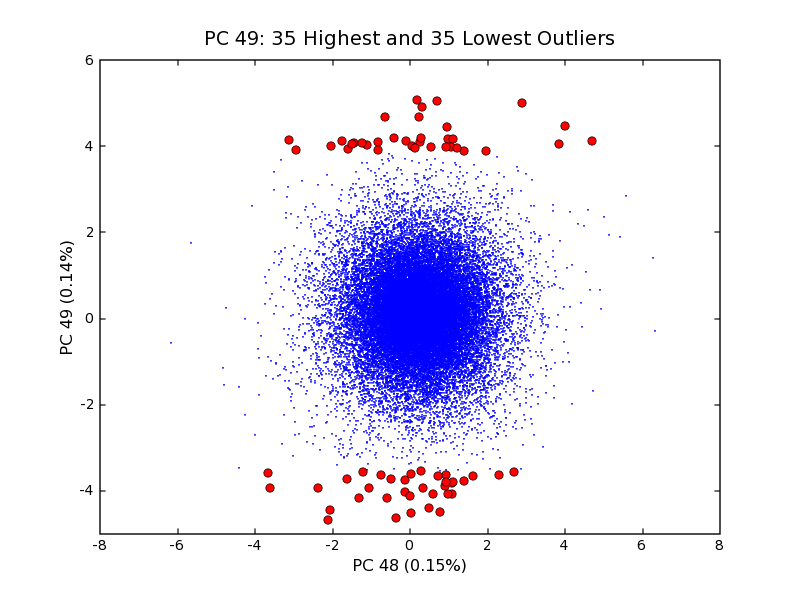
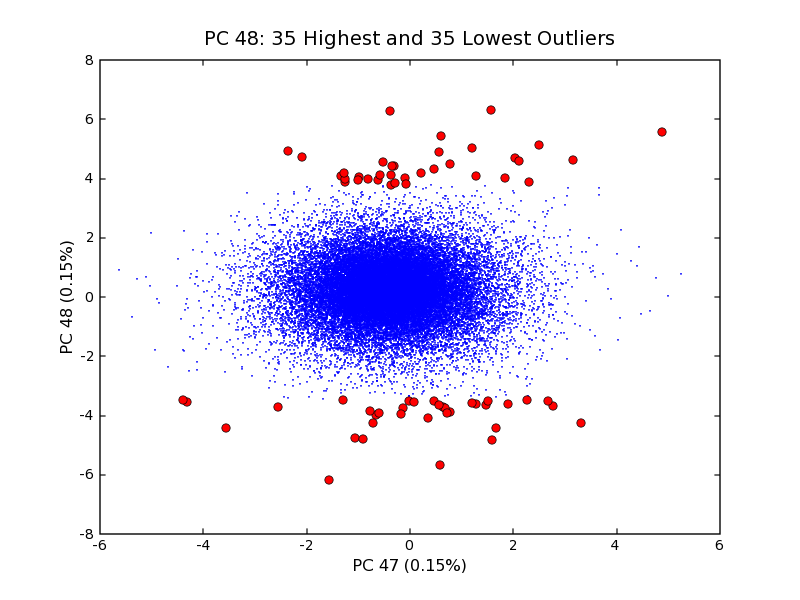
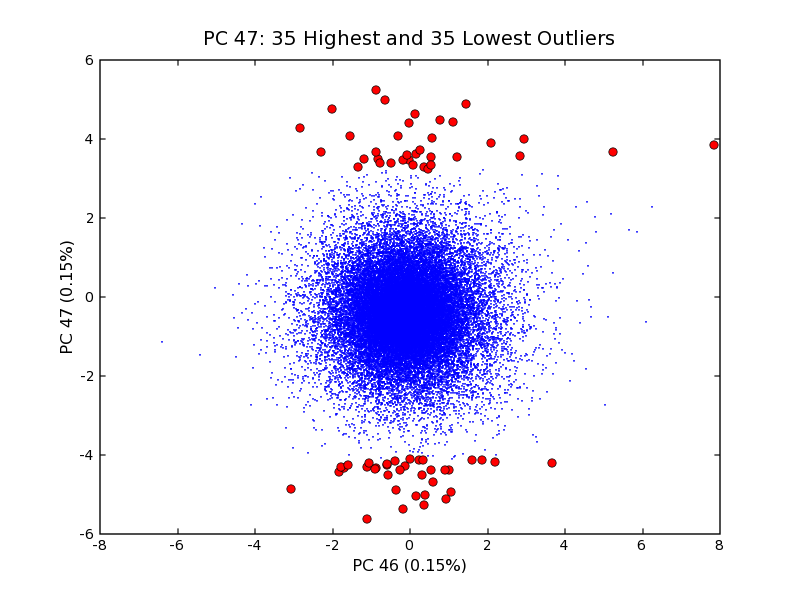
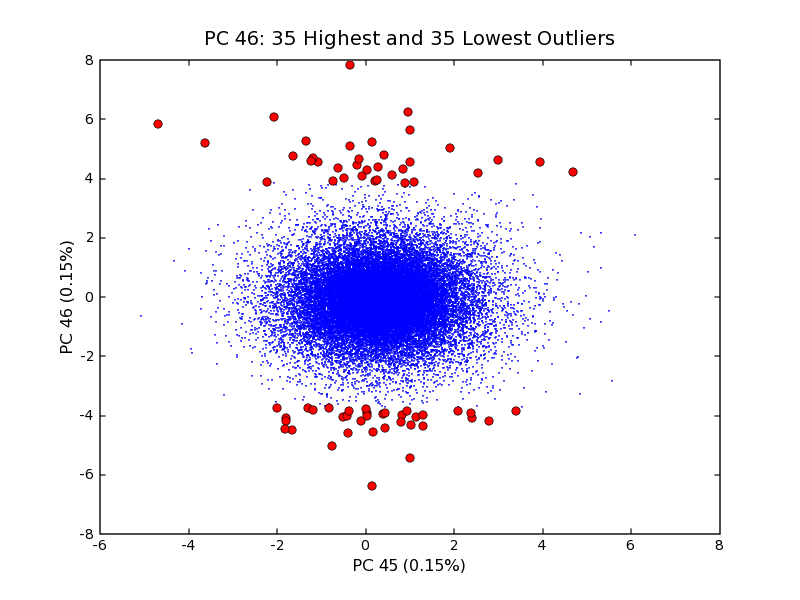
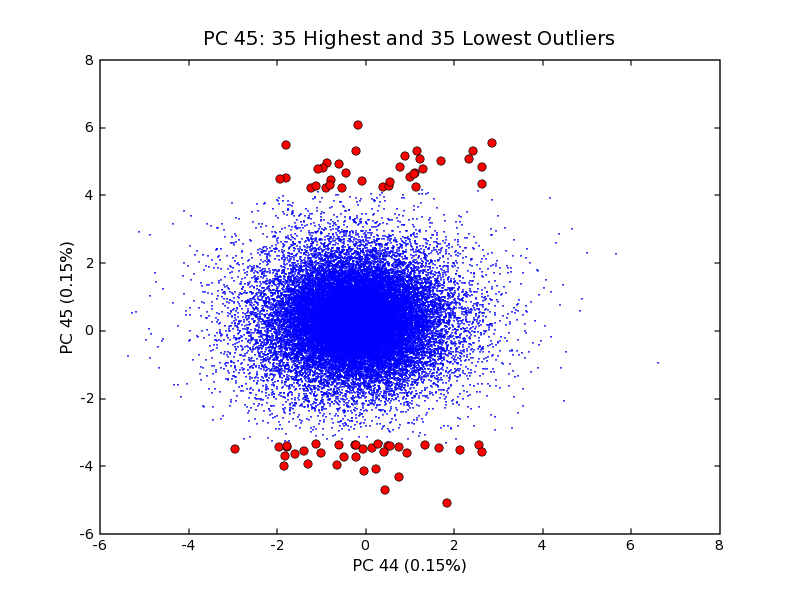
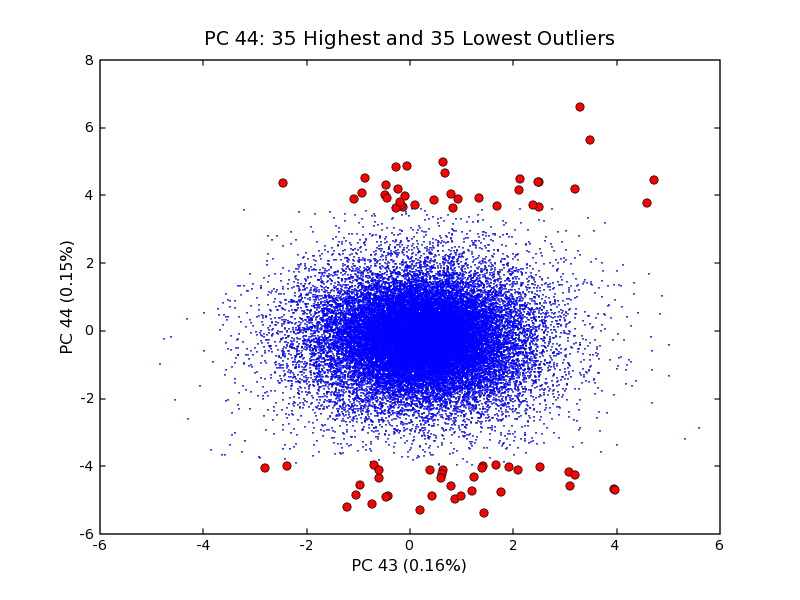
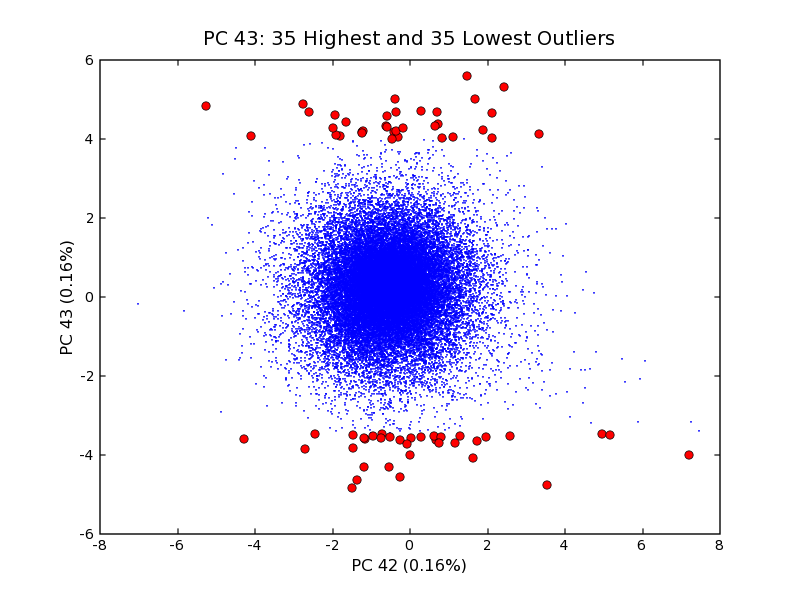
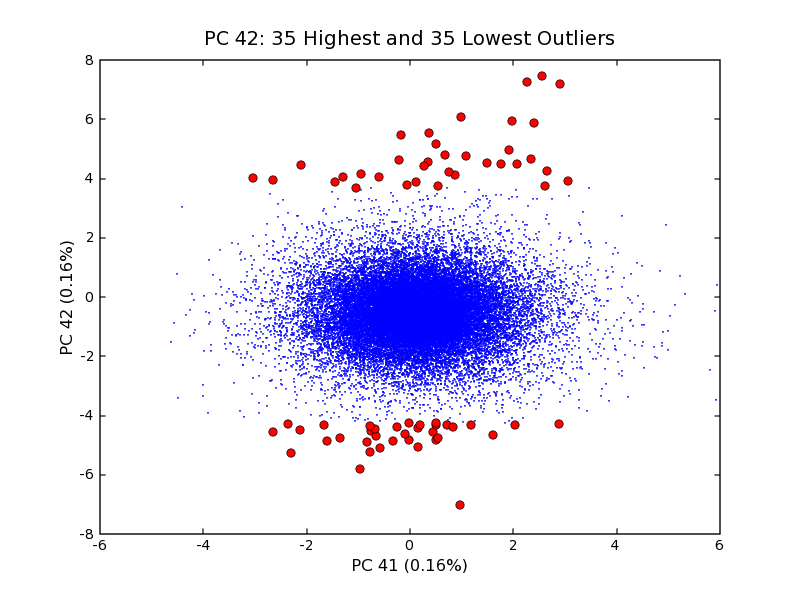
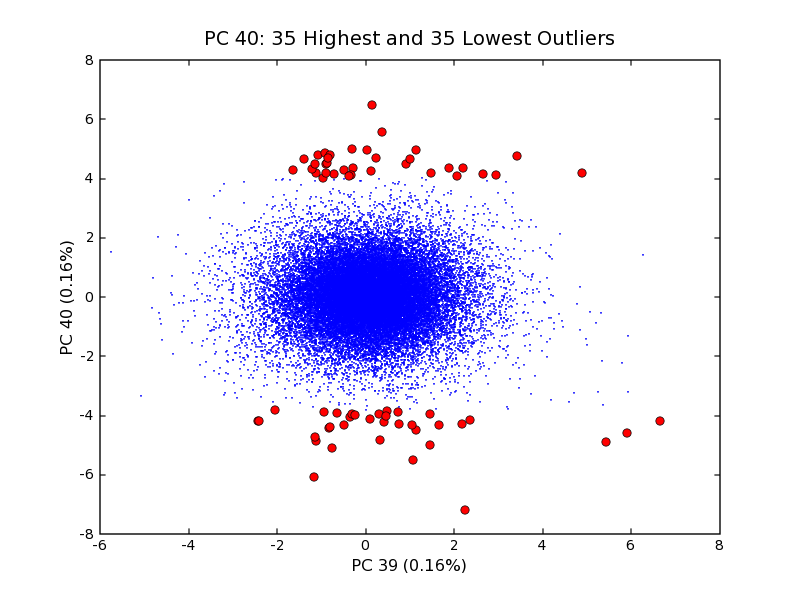
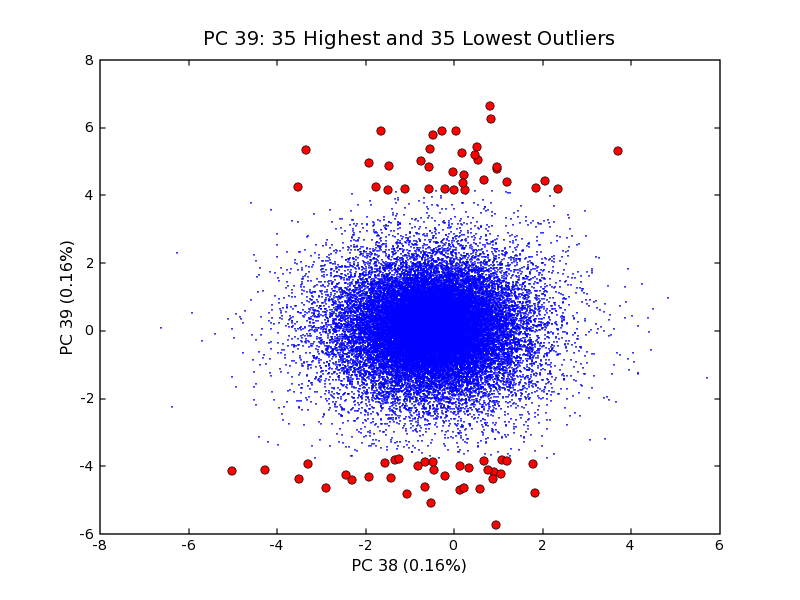
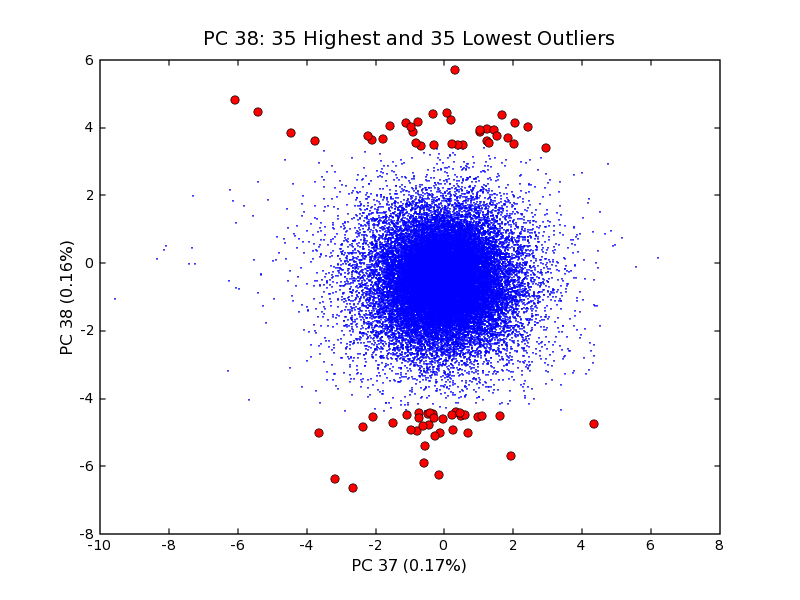
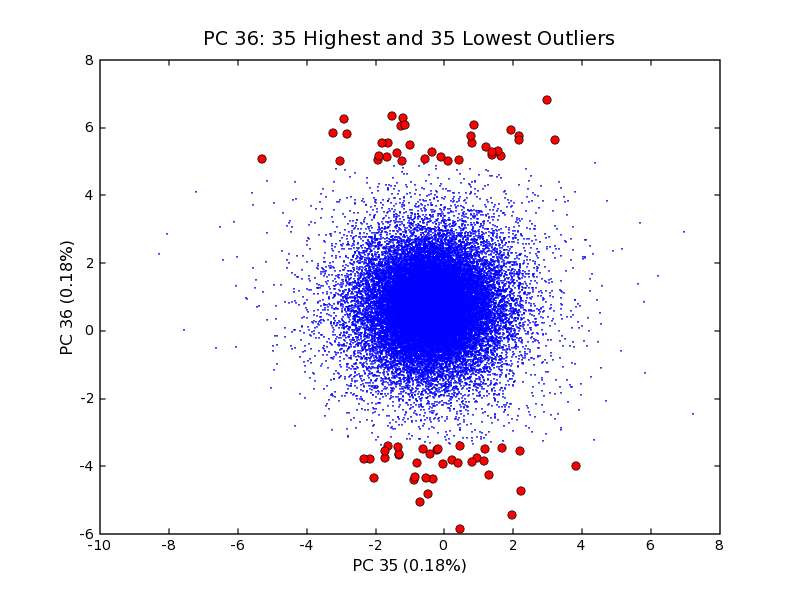
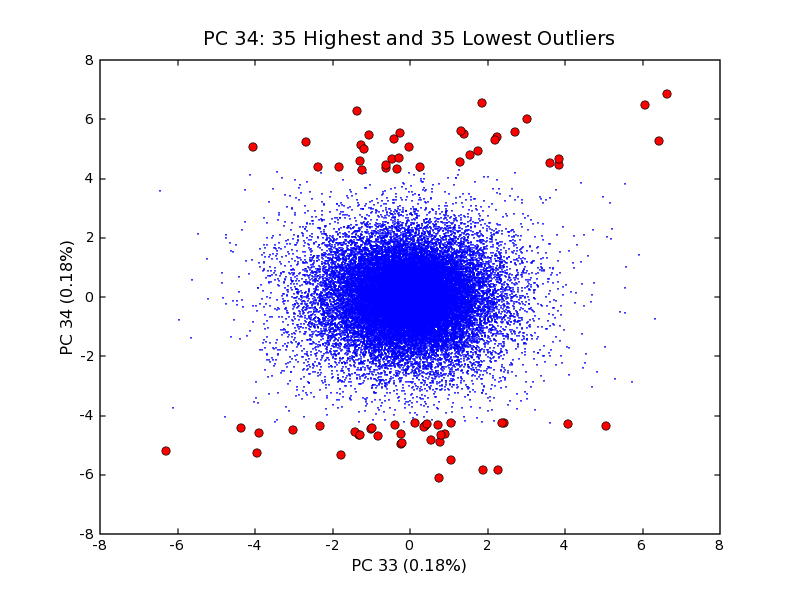
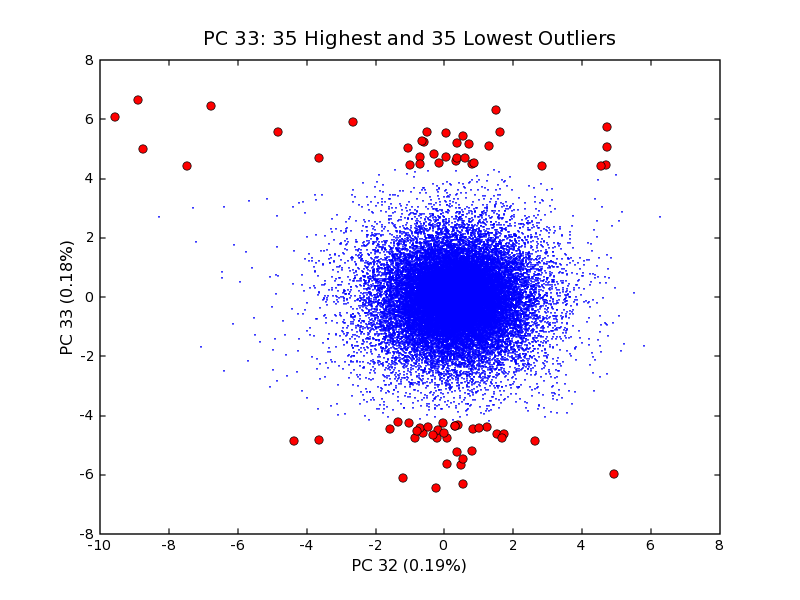
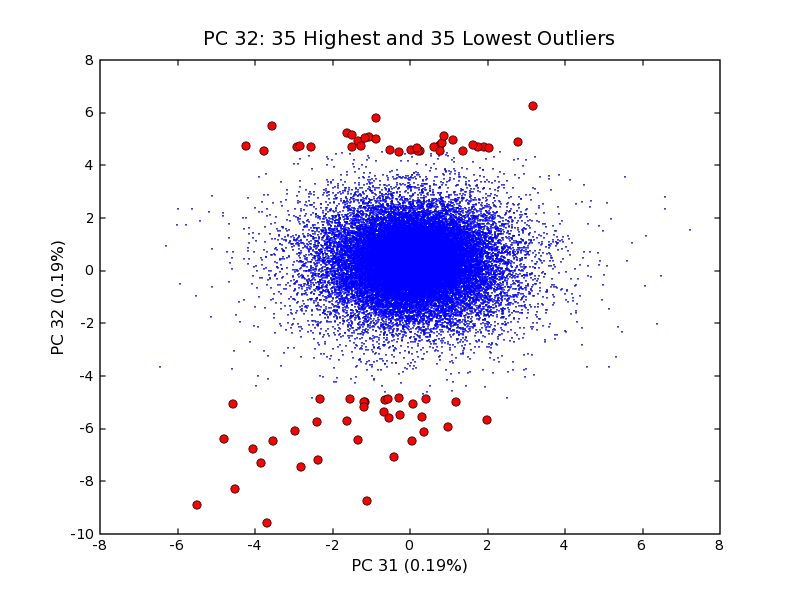
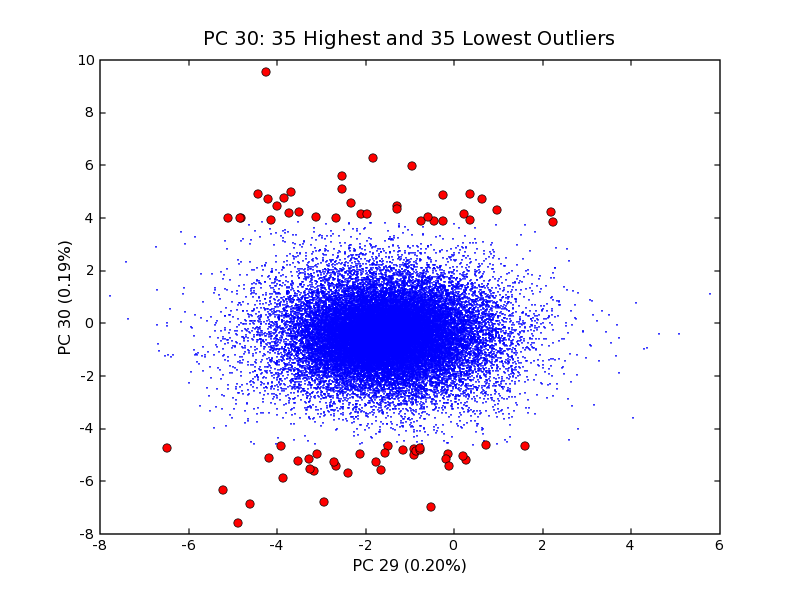
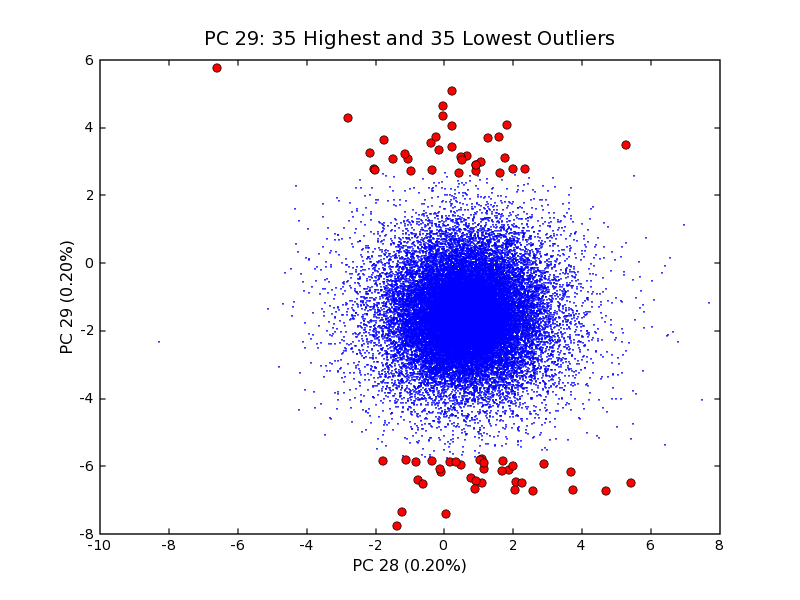
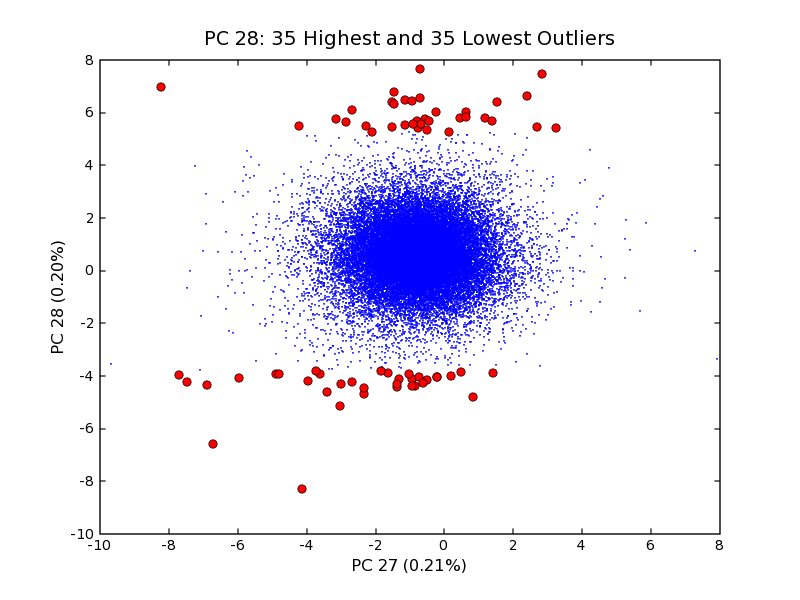
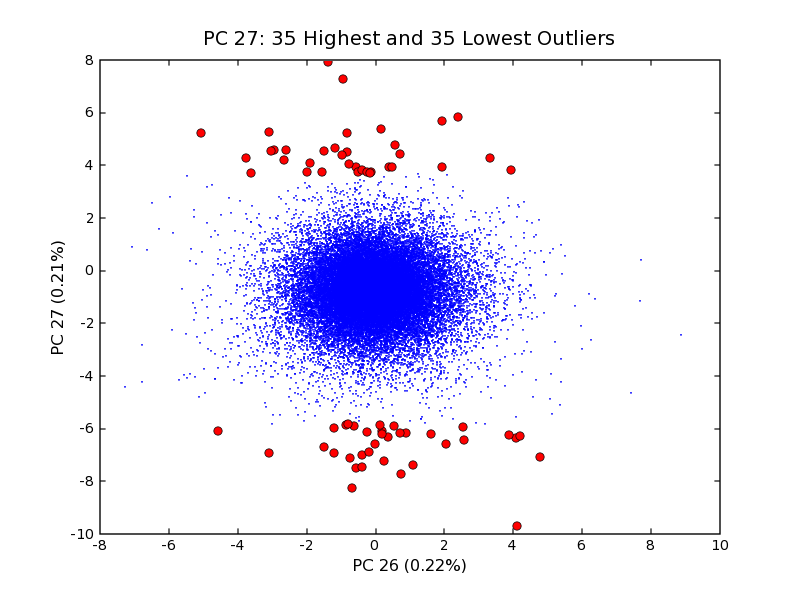
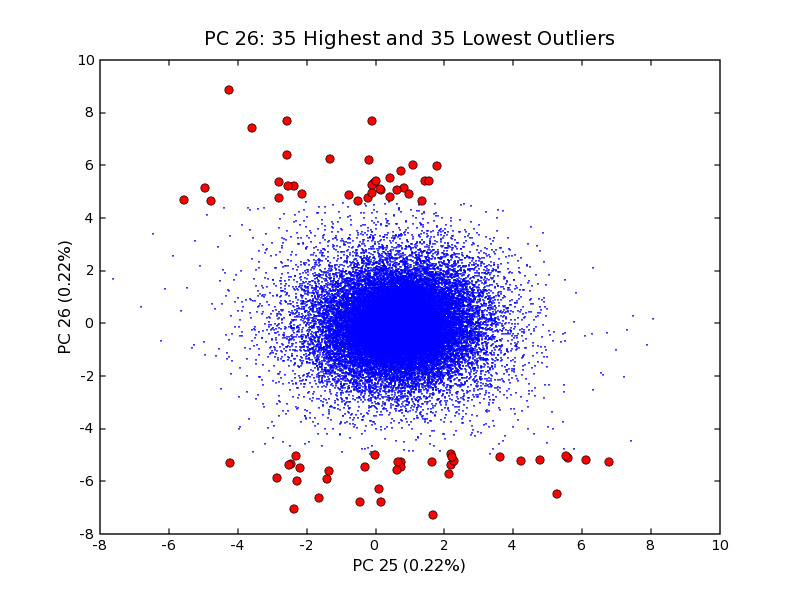
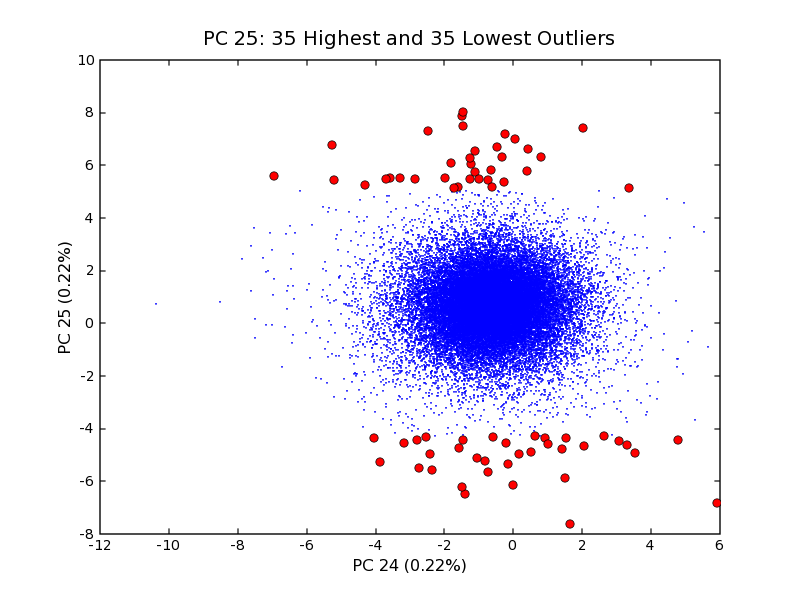
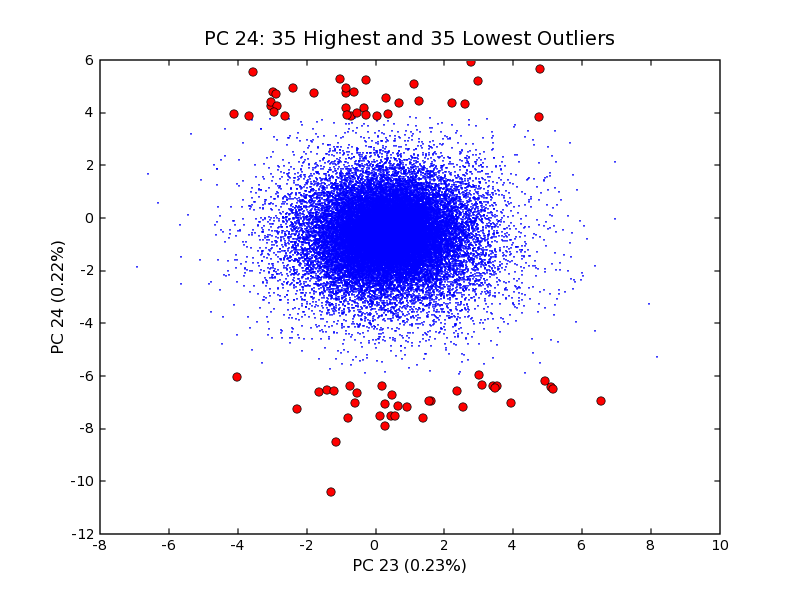
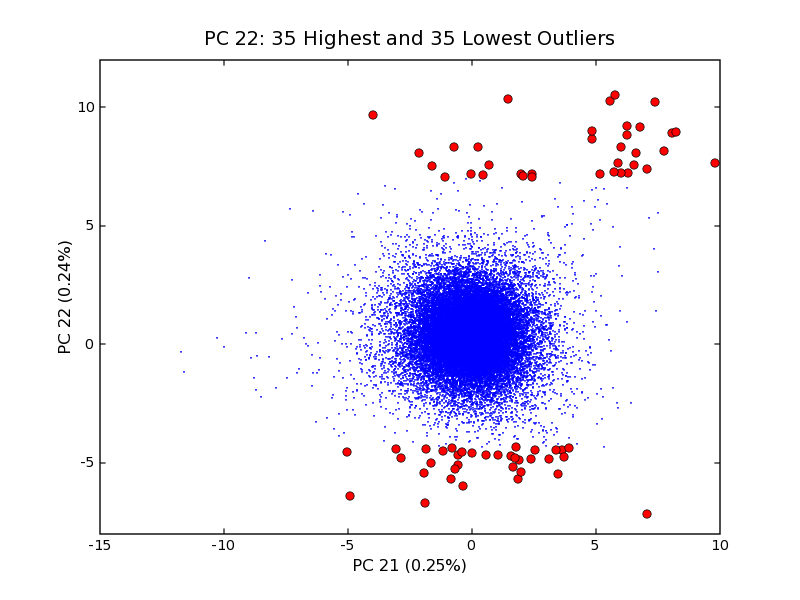
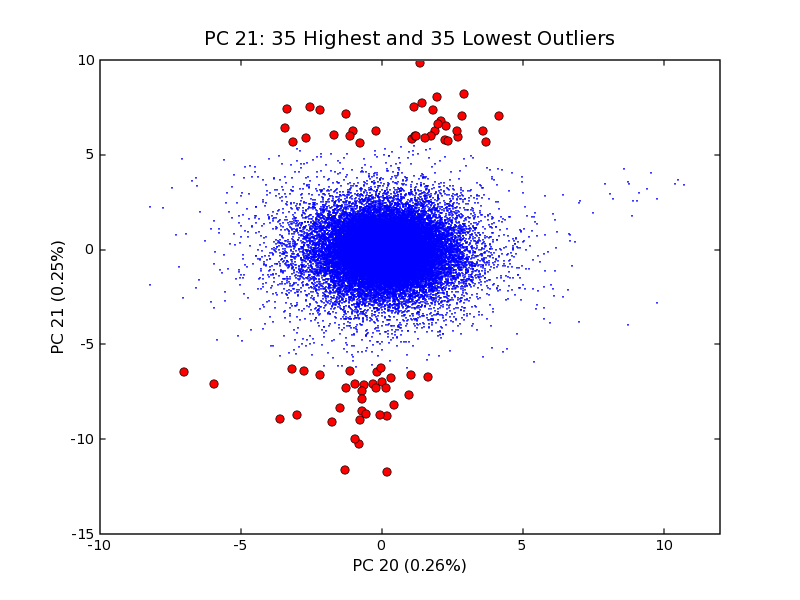
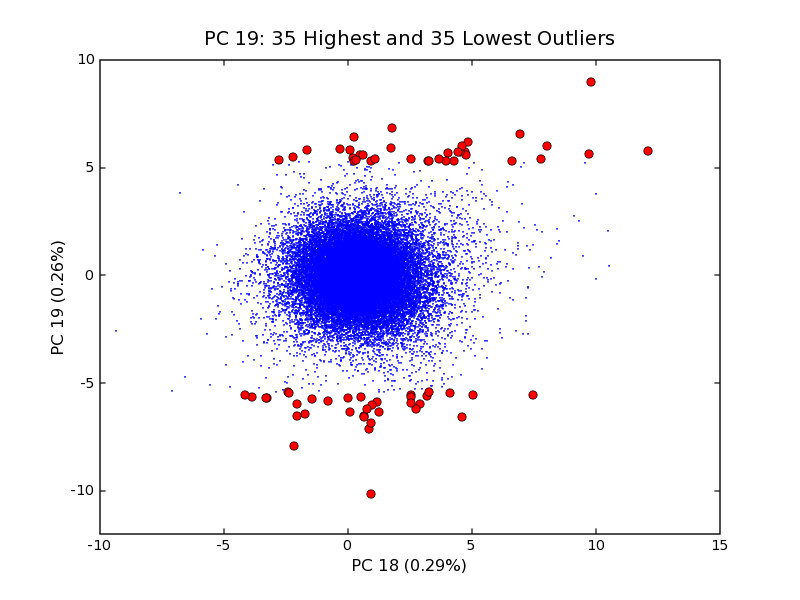
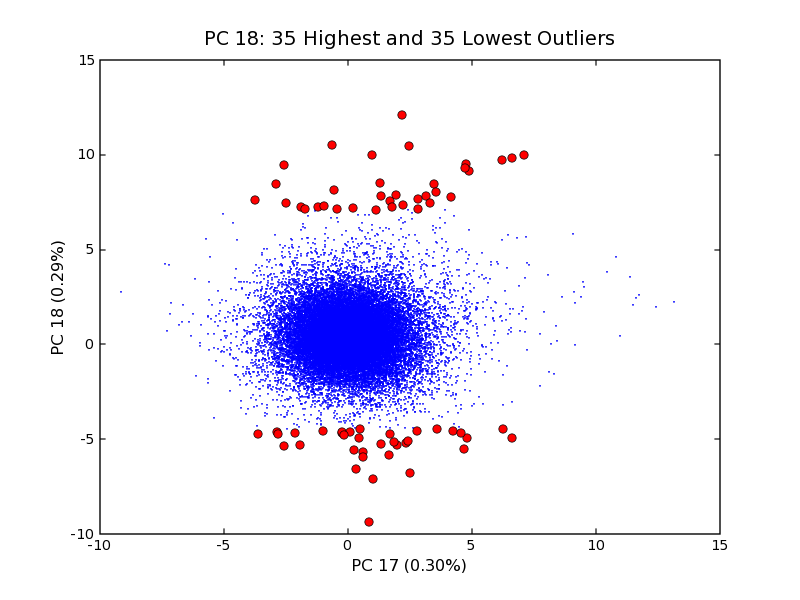
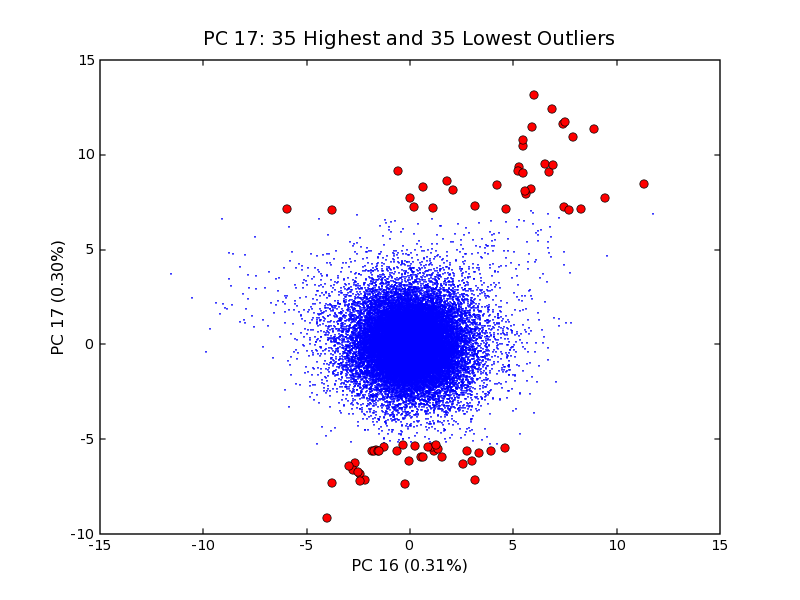
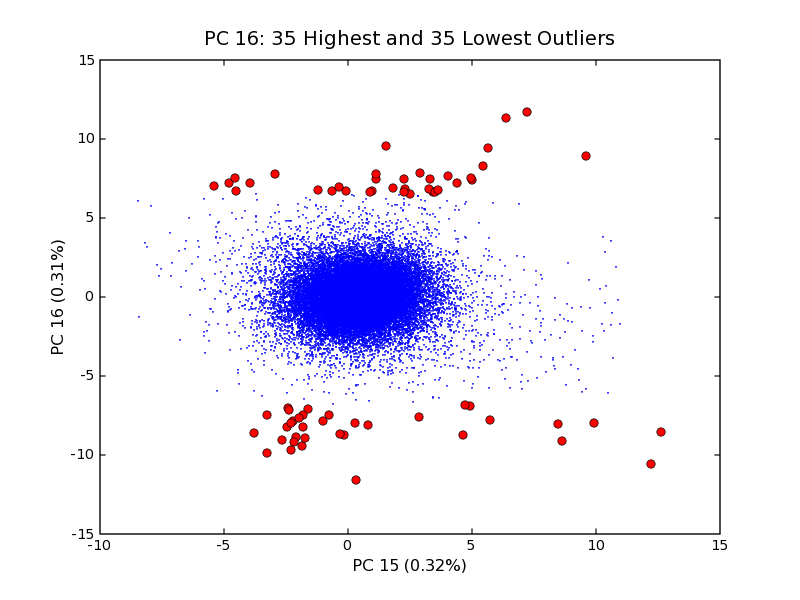
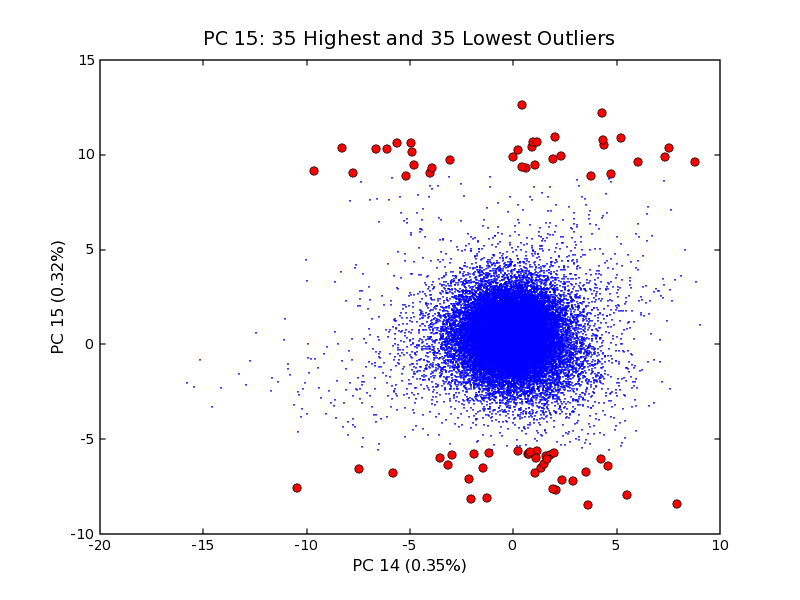
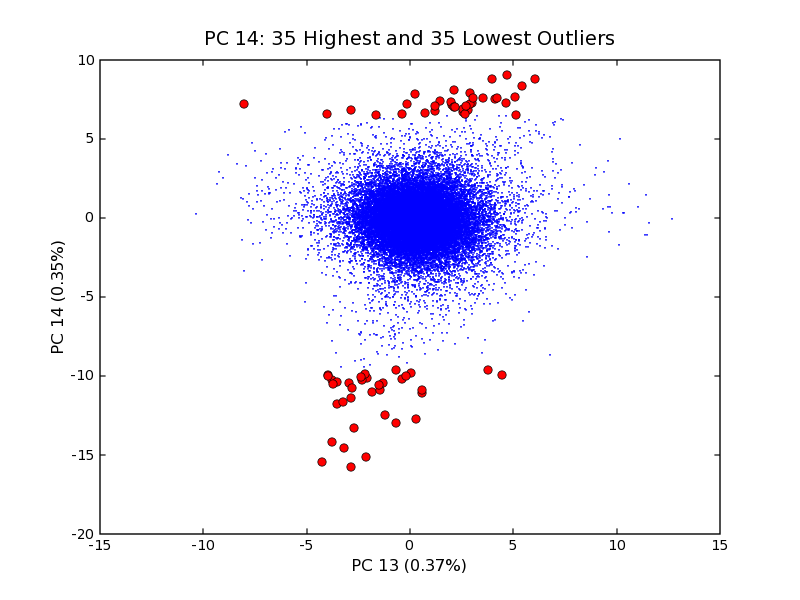
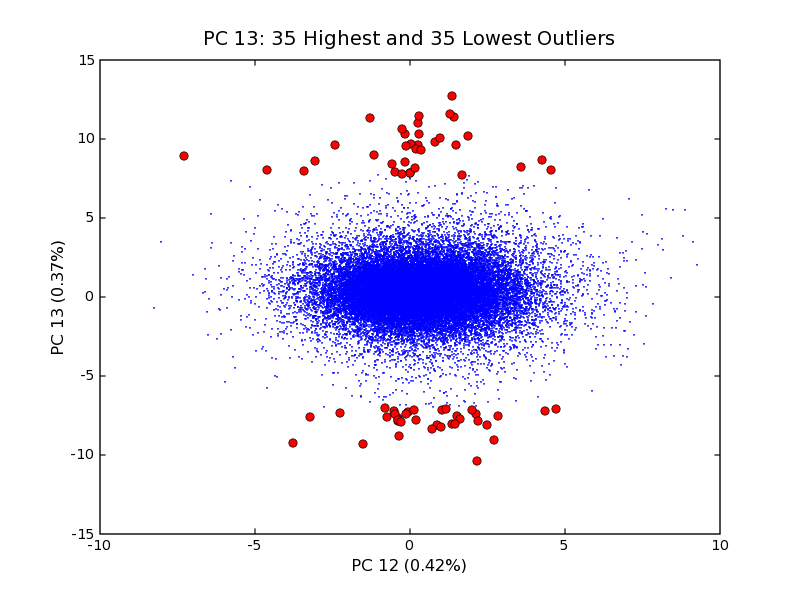
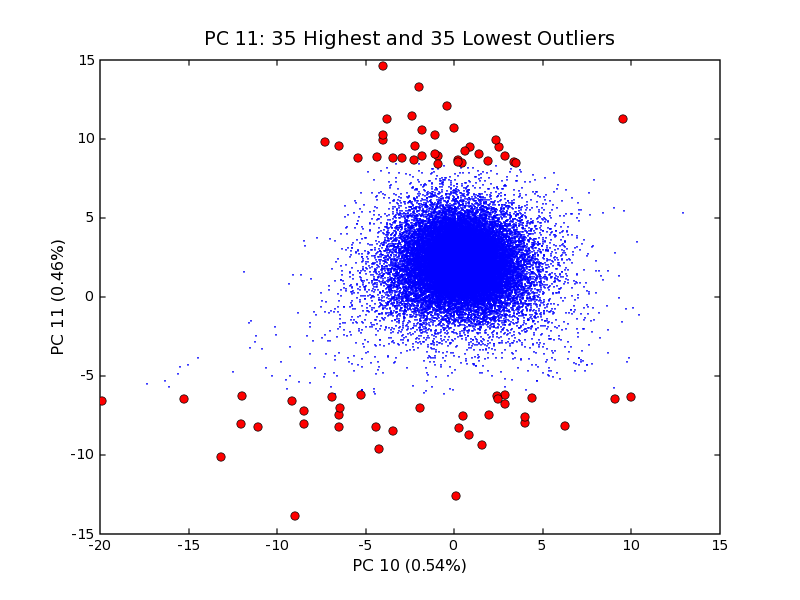
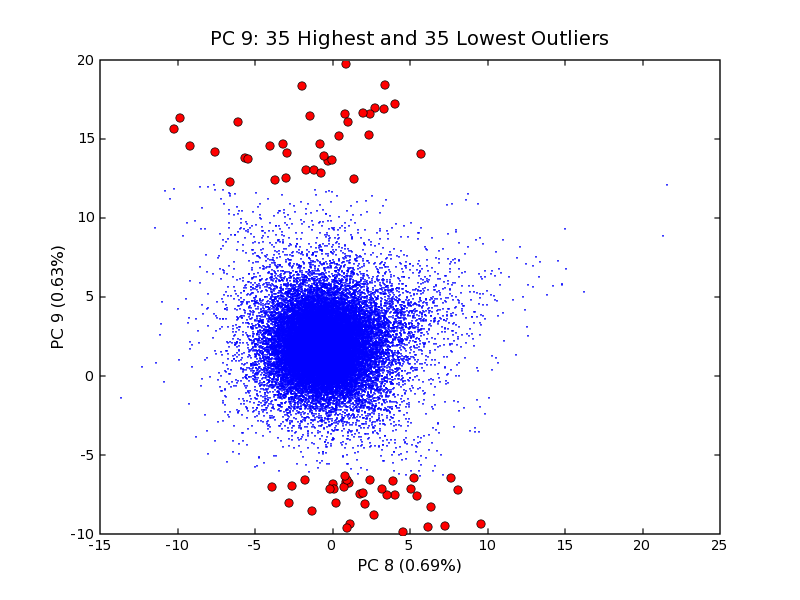
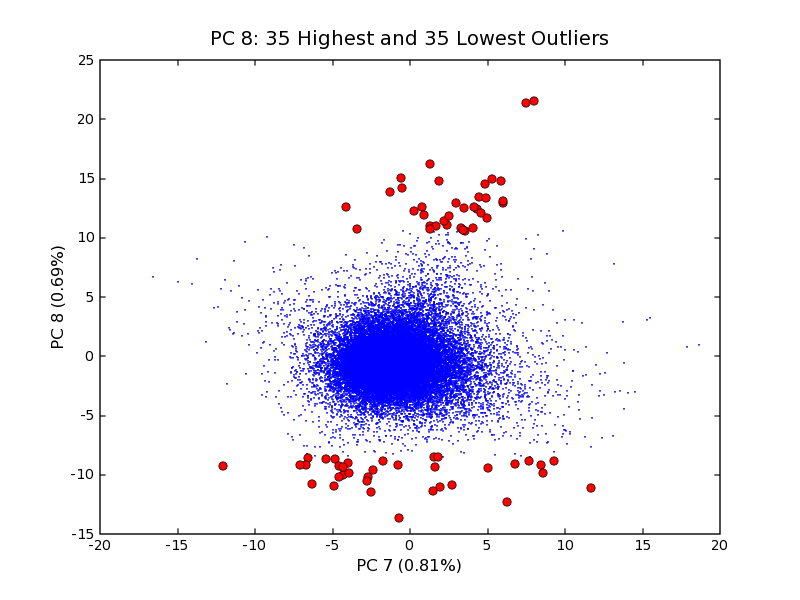
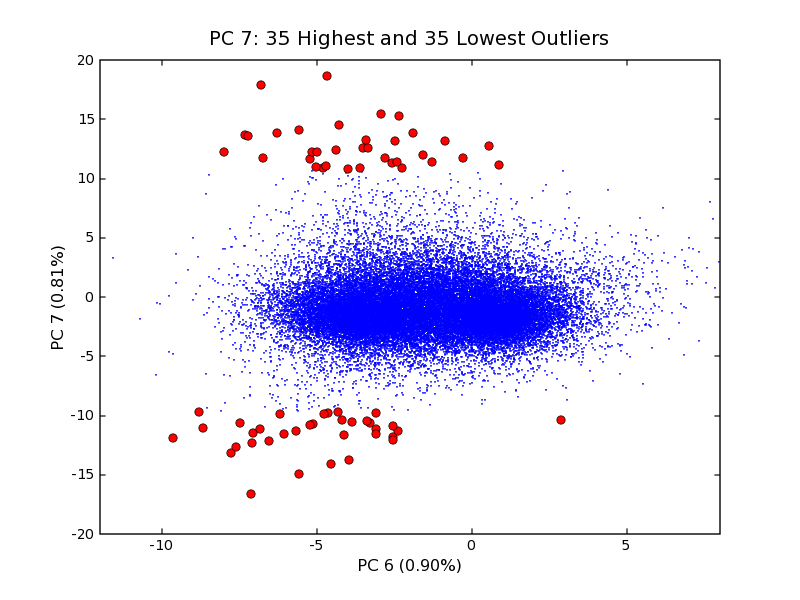
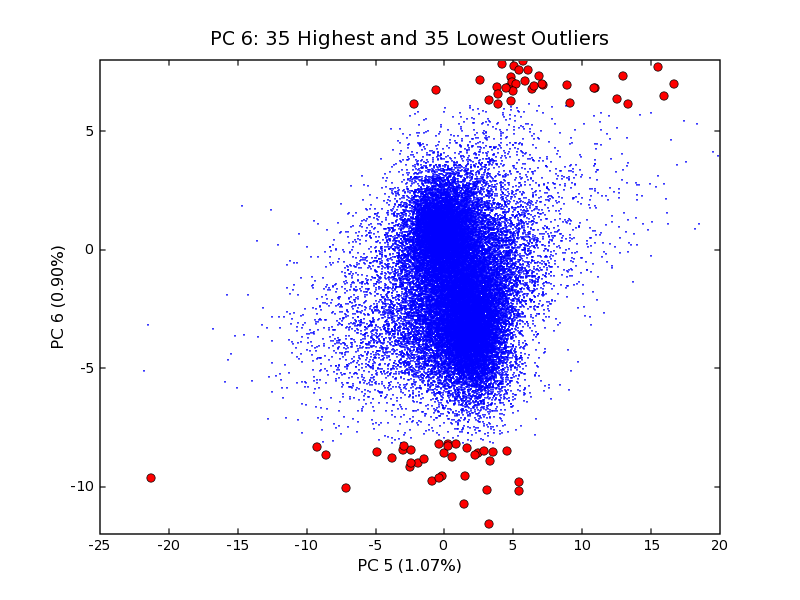
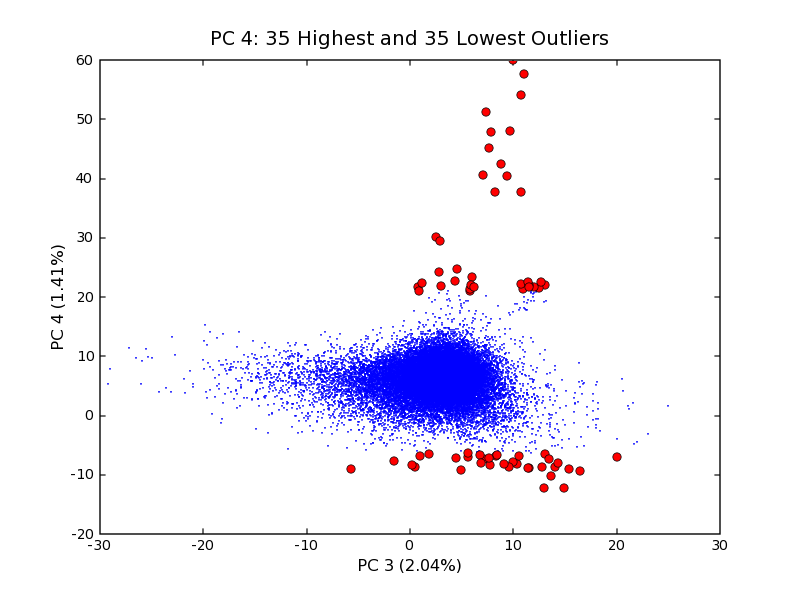
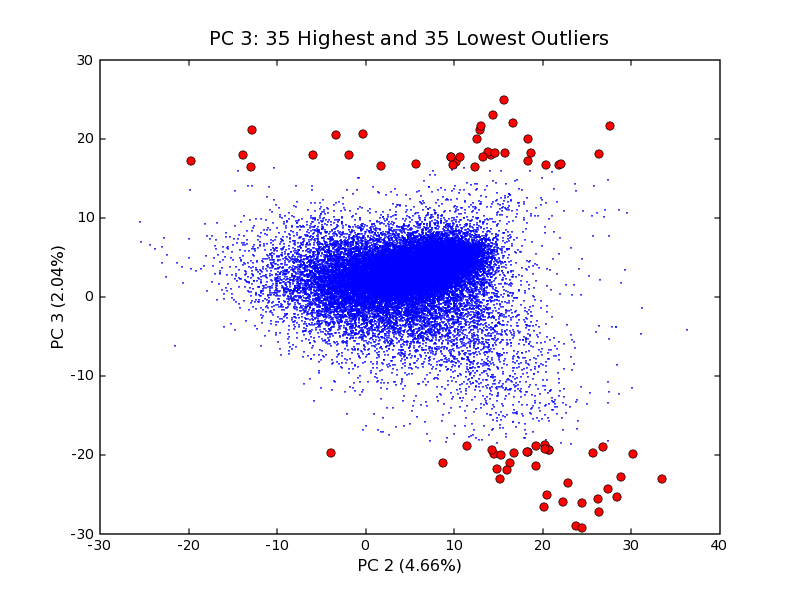
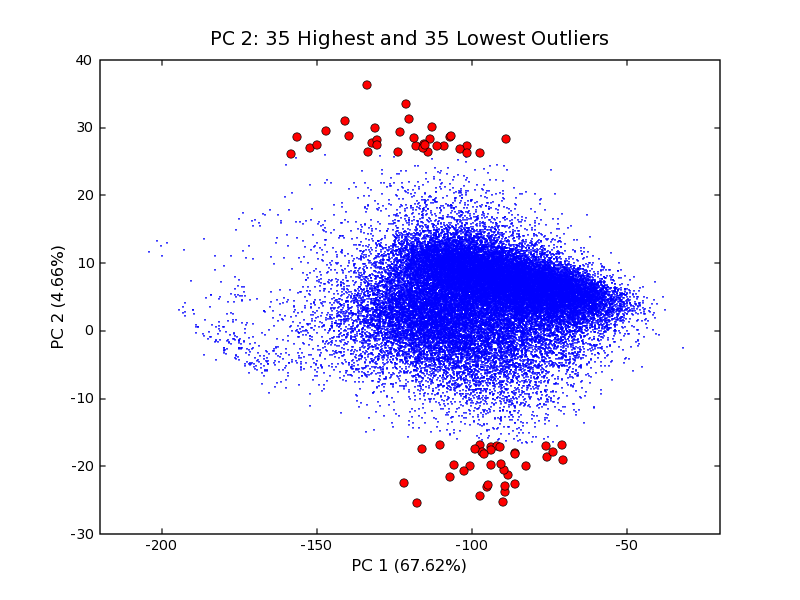
| pcNN-outliers.png | Scatter plot of probe expression levels projected onto PCn-1 vs PCn space with high and low outlier sets highlighted in red. |
| pcNN-condition-groups.txt | Tab-delimited text file listing the conditions that are up, flat and down for pcNN, ordered by decreasing difference of means. |
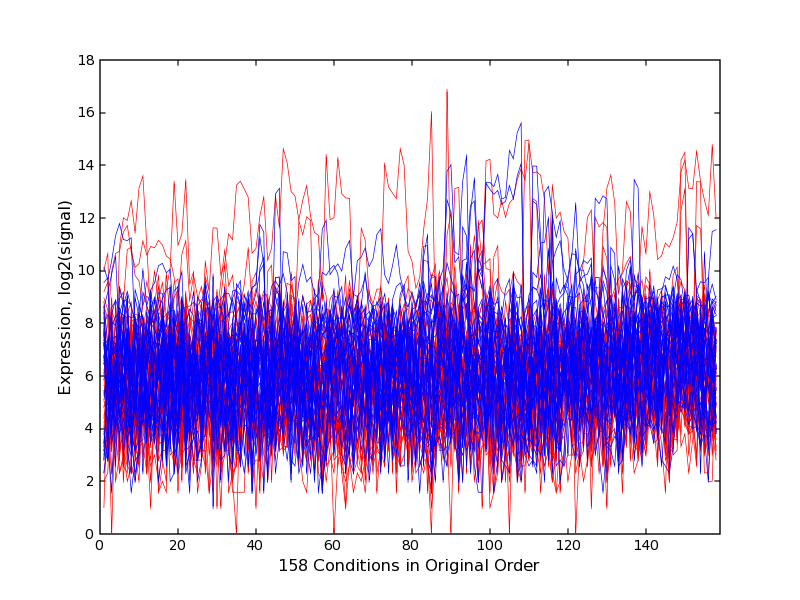
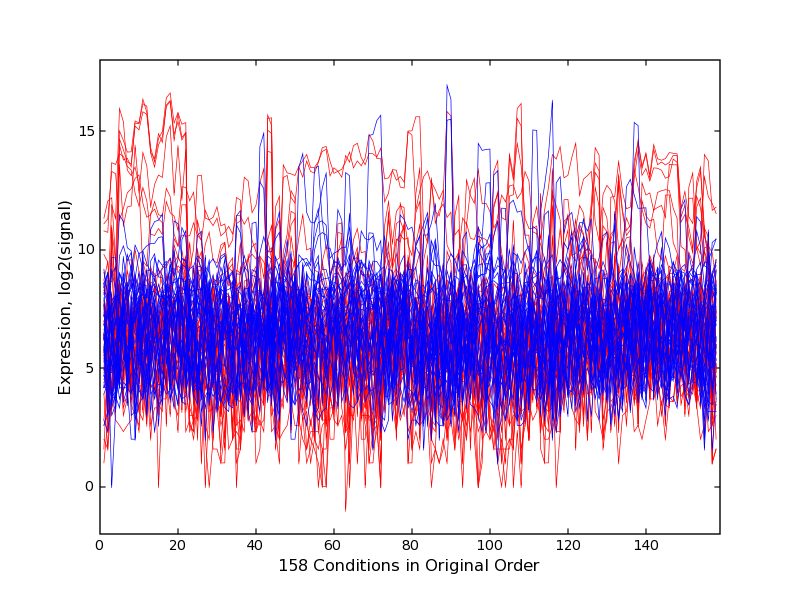
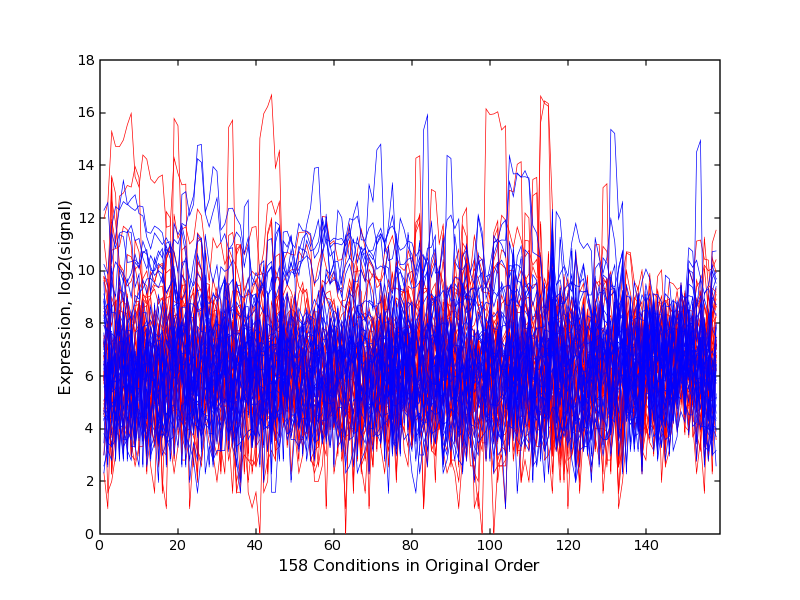
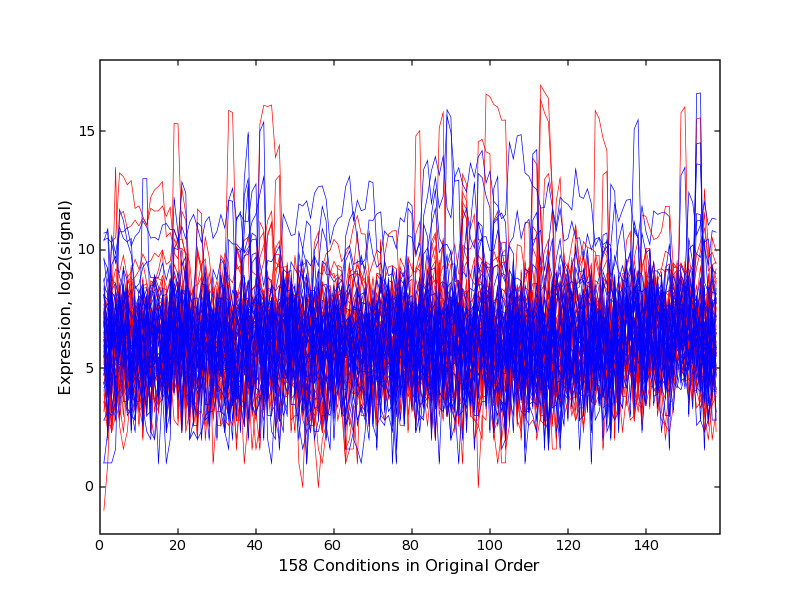
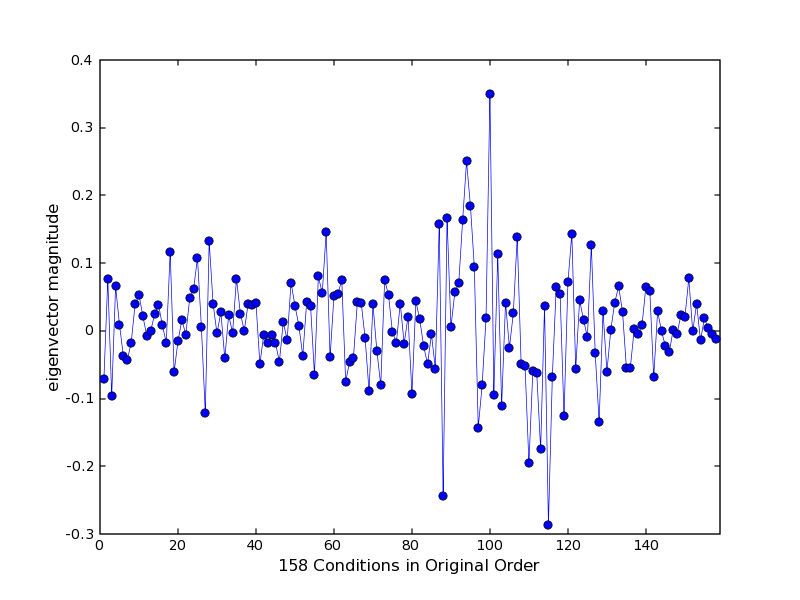
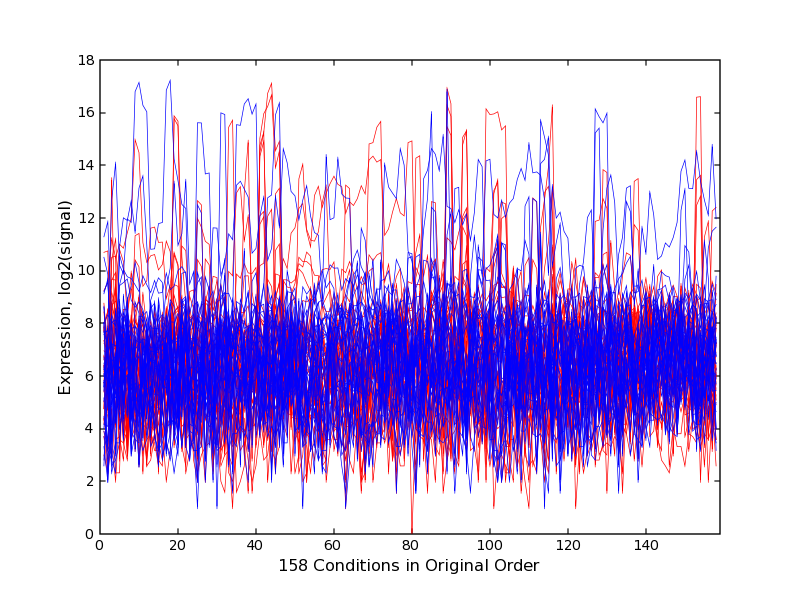
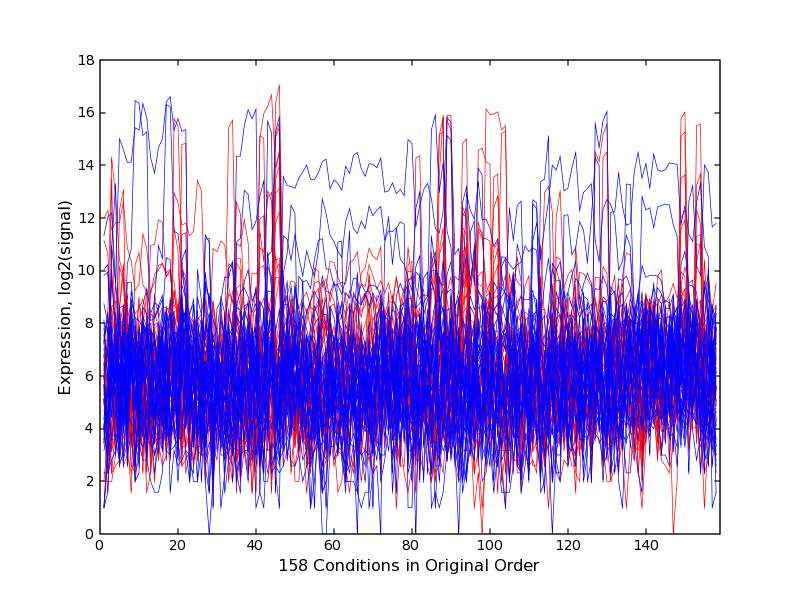
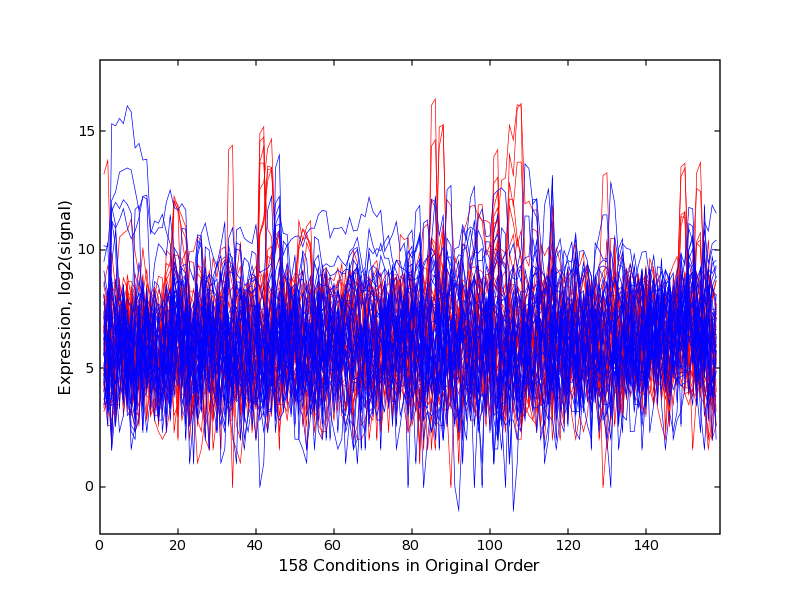
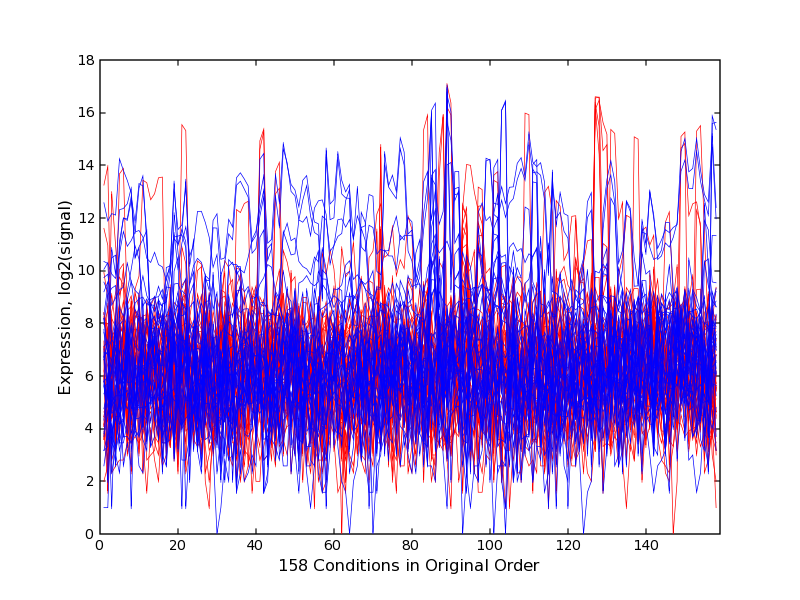
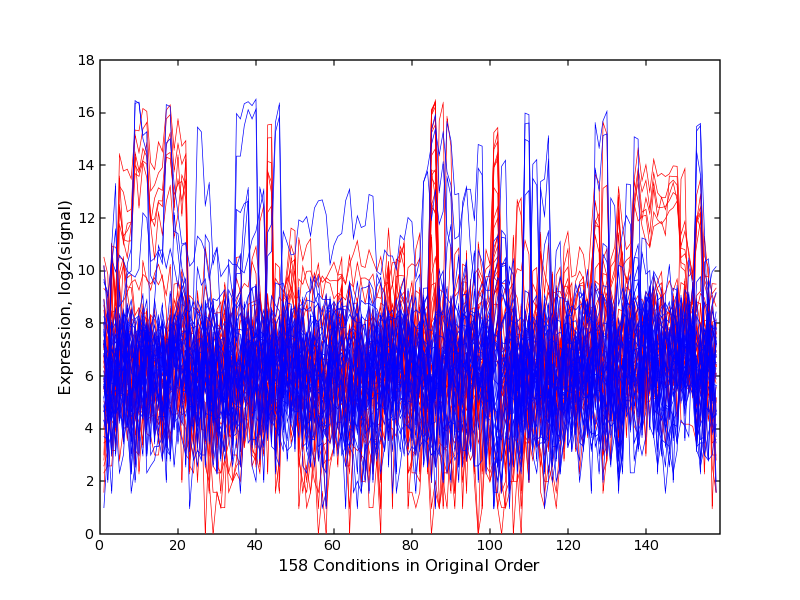
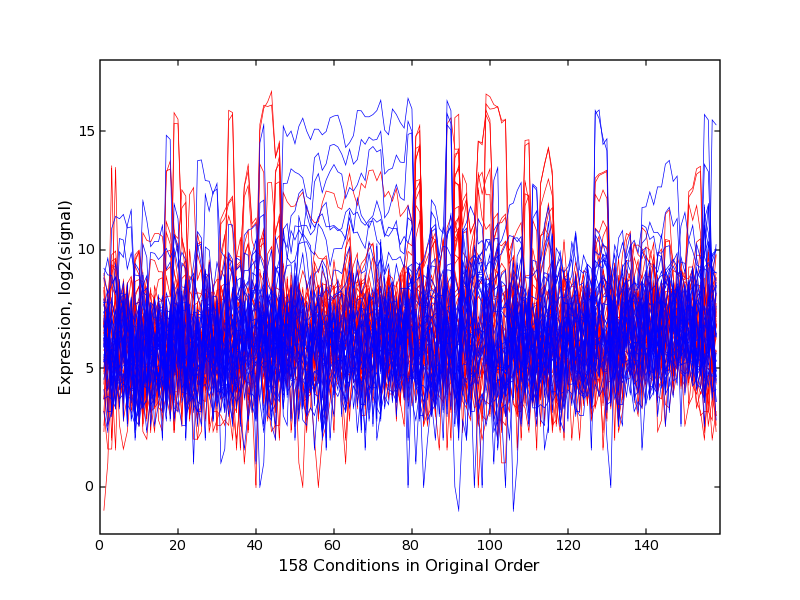
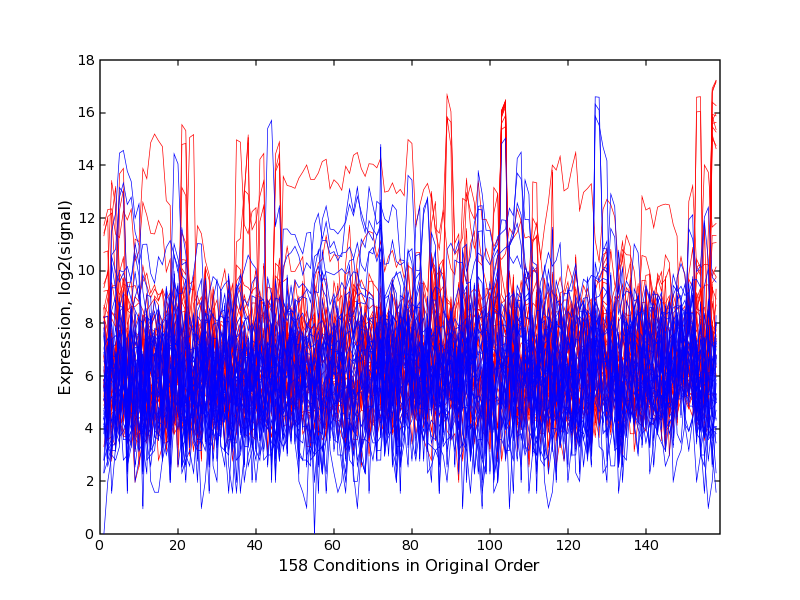
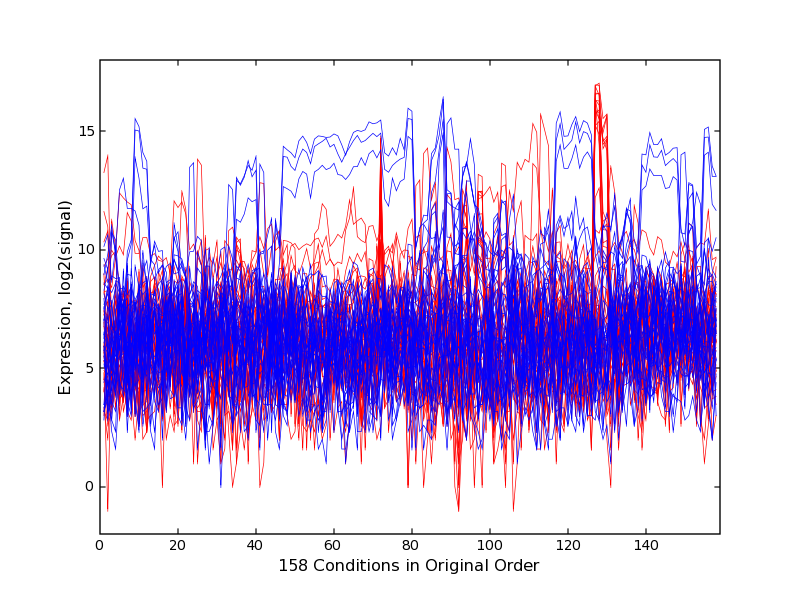
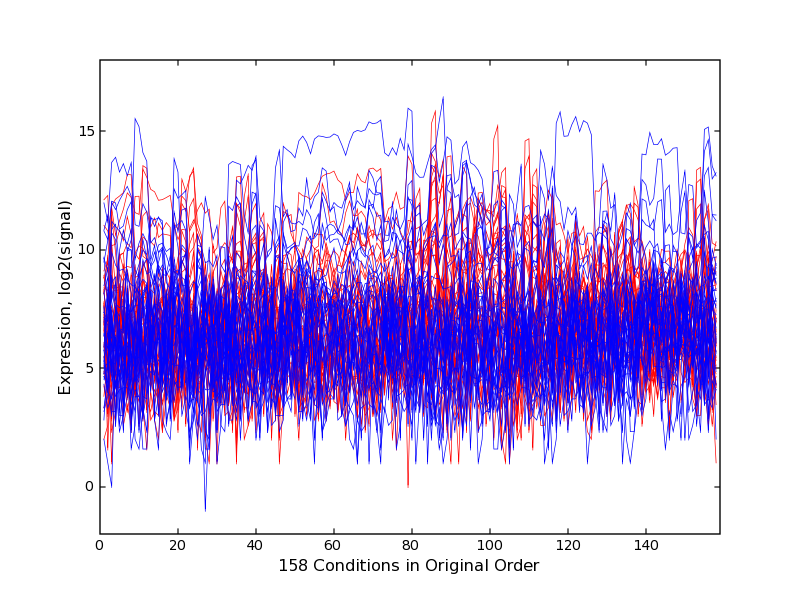
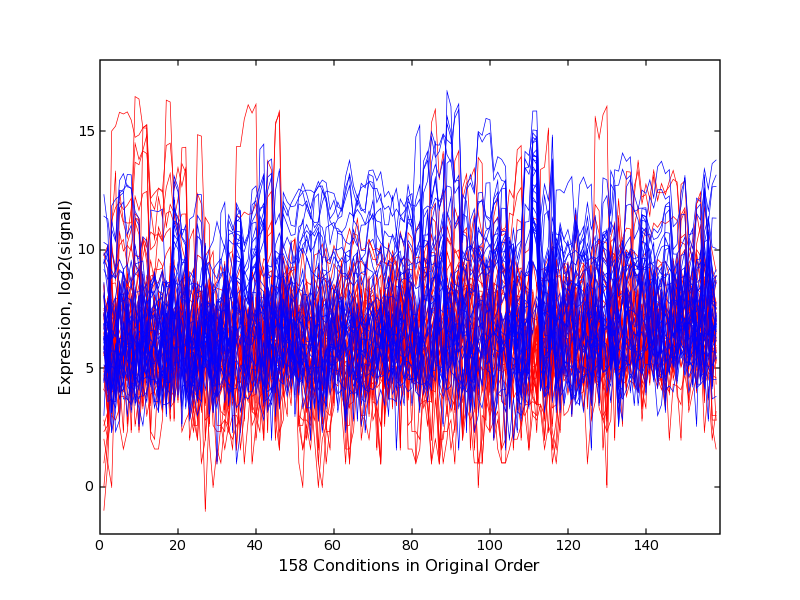
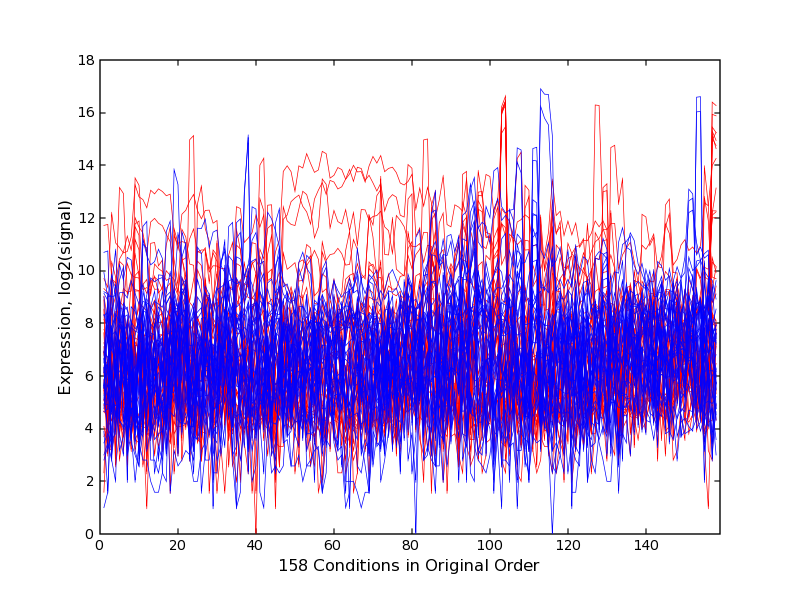
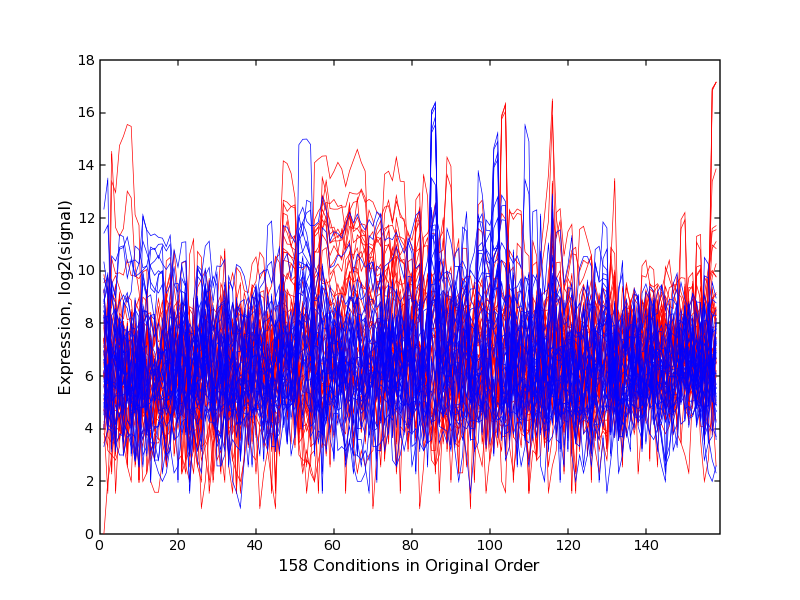
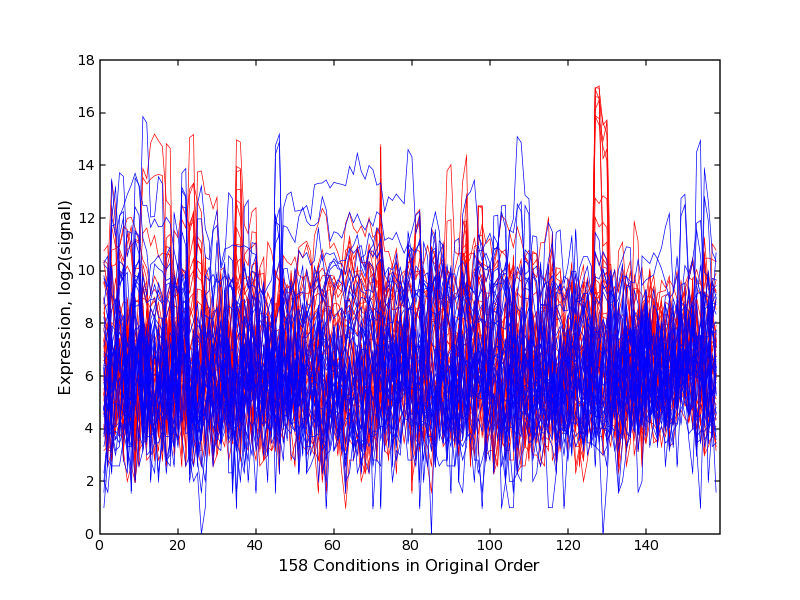
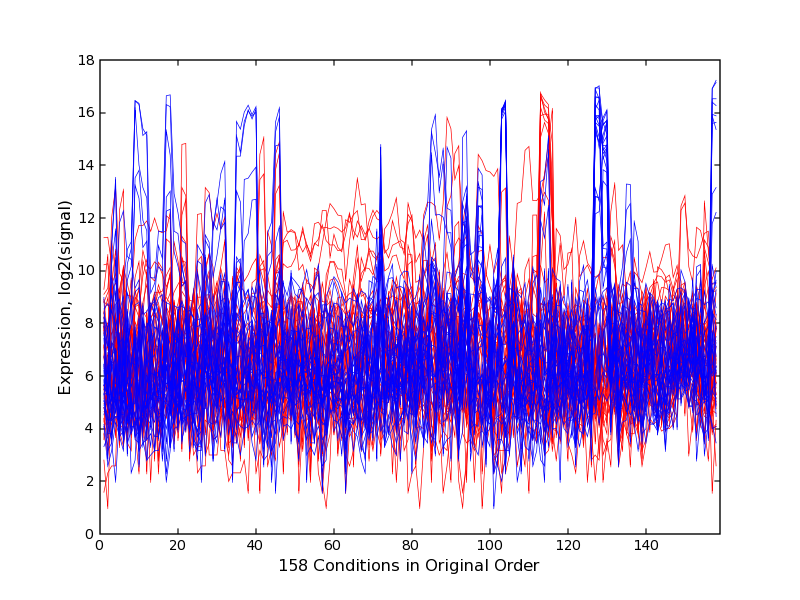
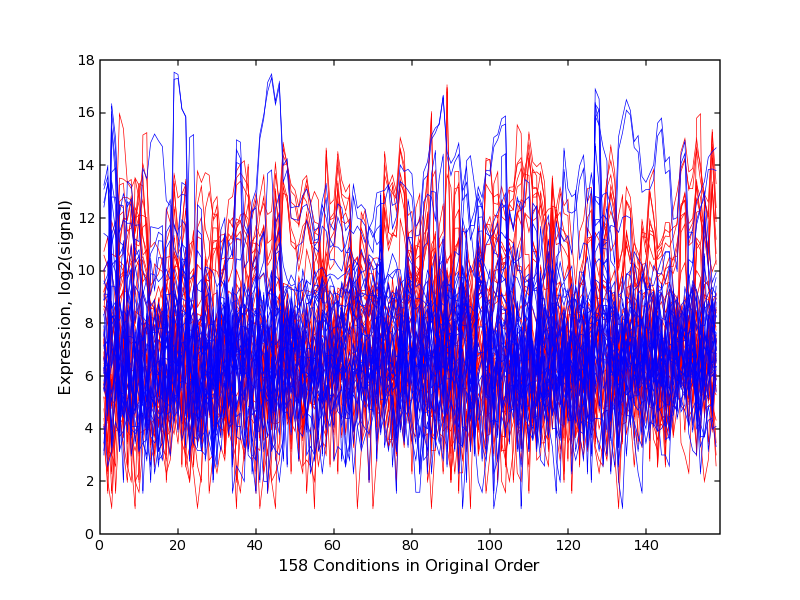
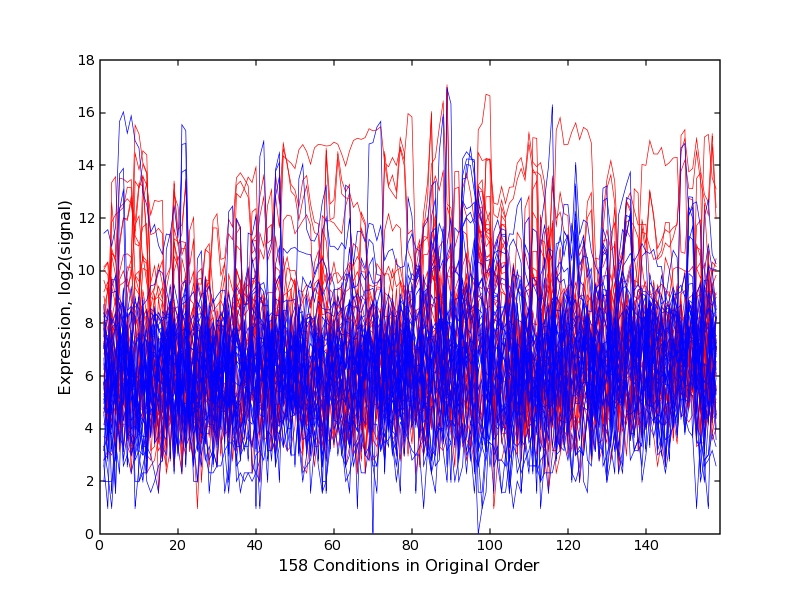
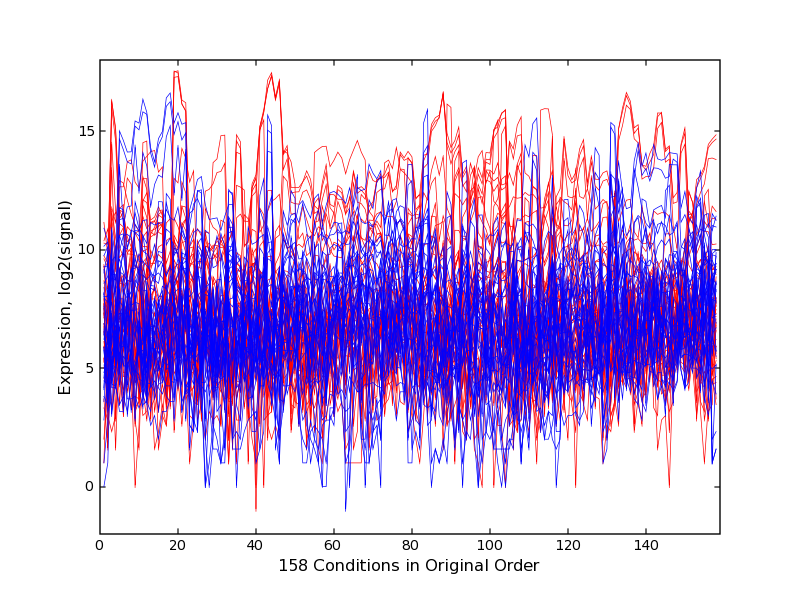
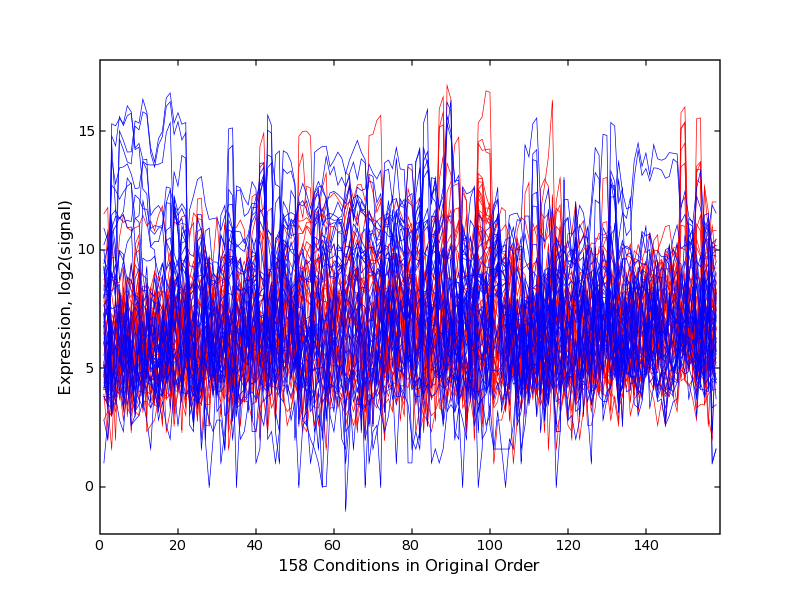
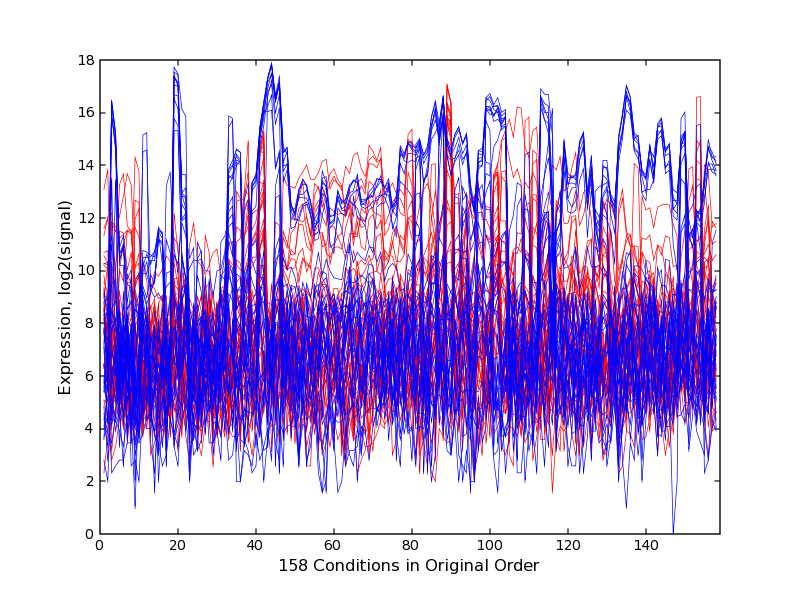
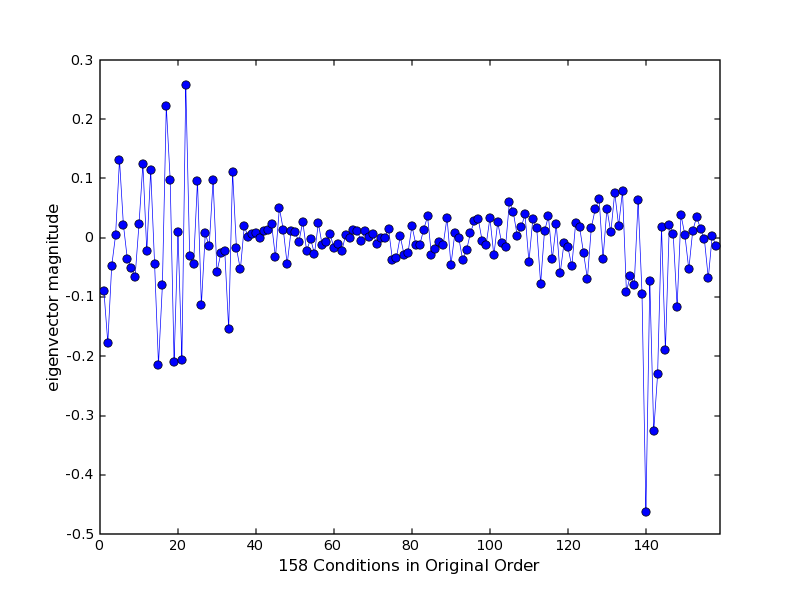
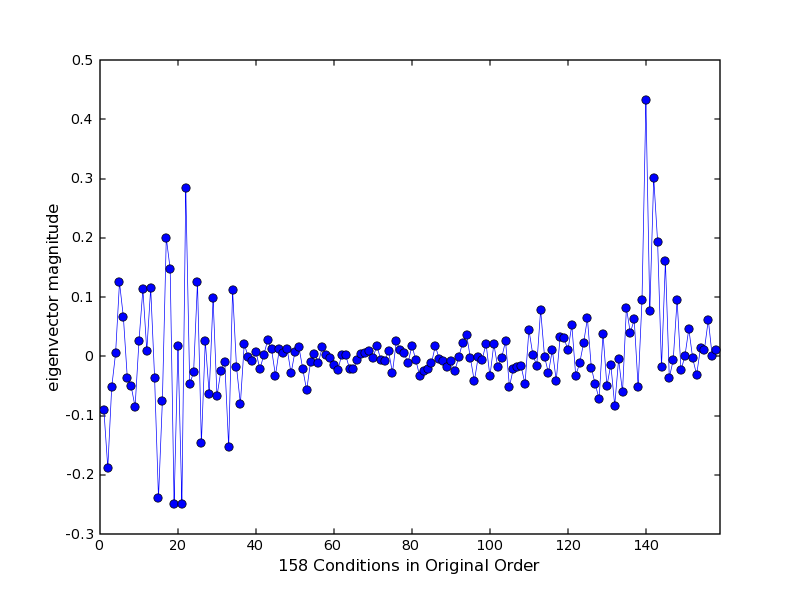
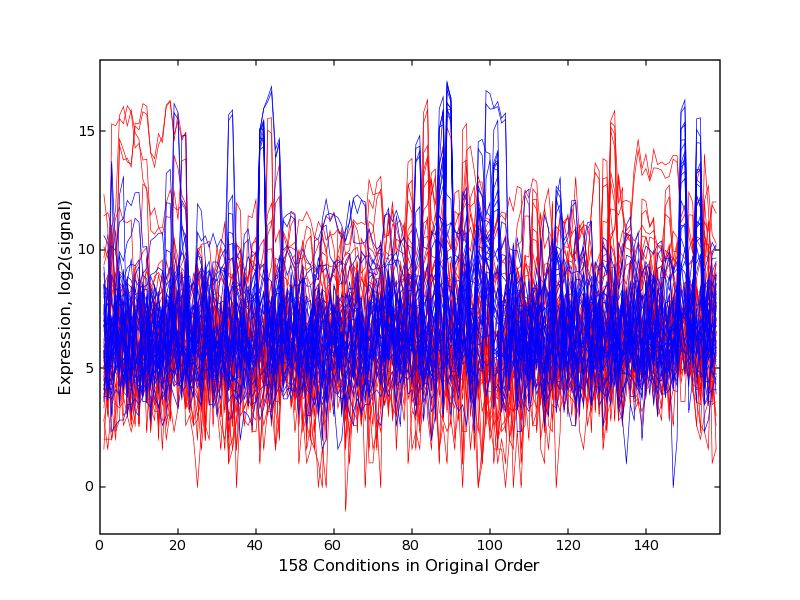
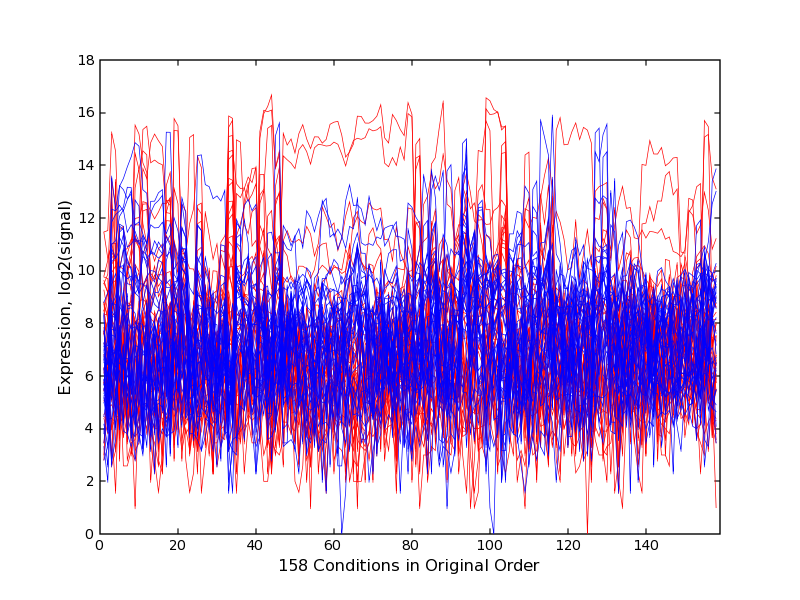
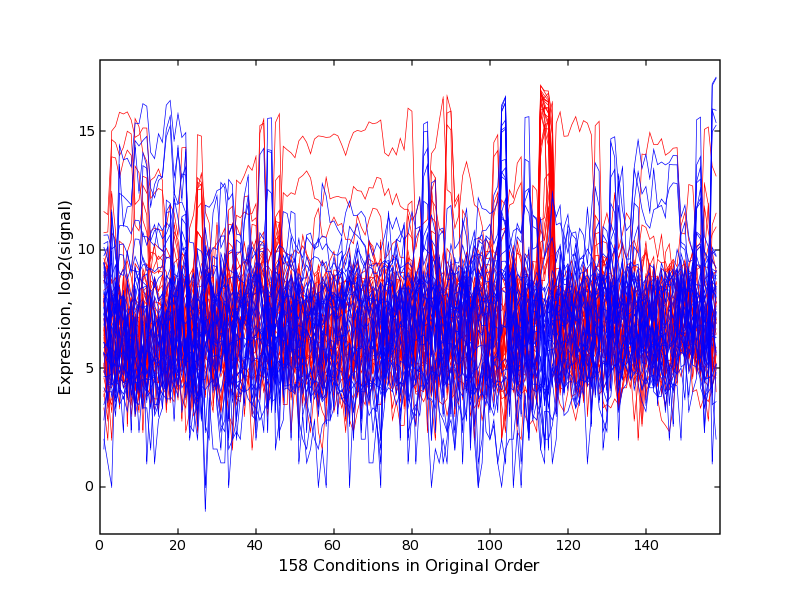
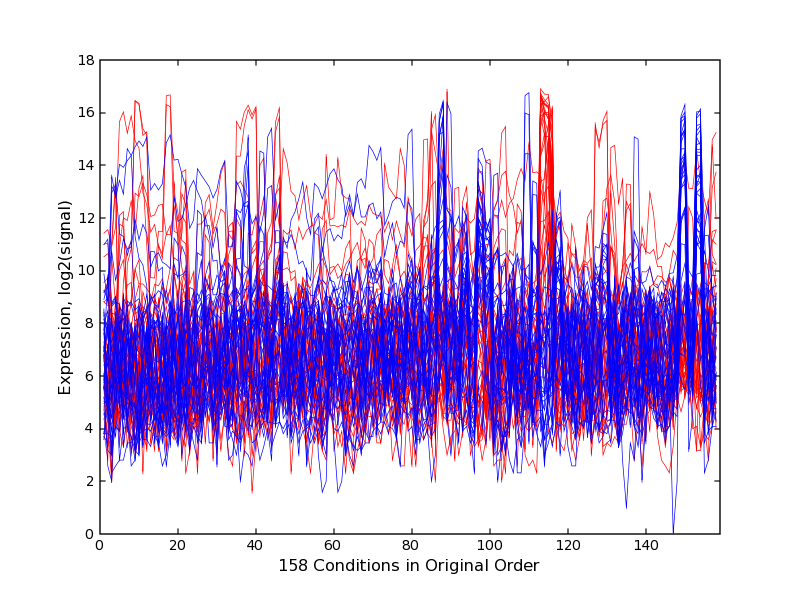
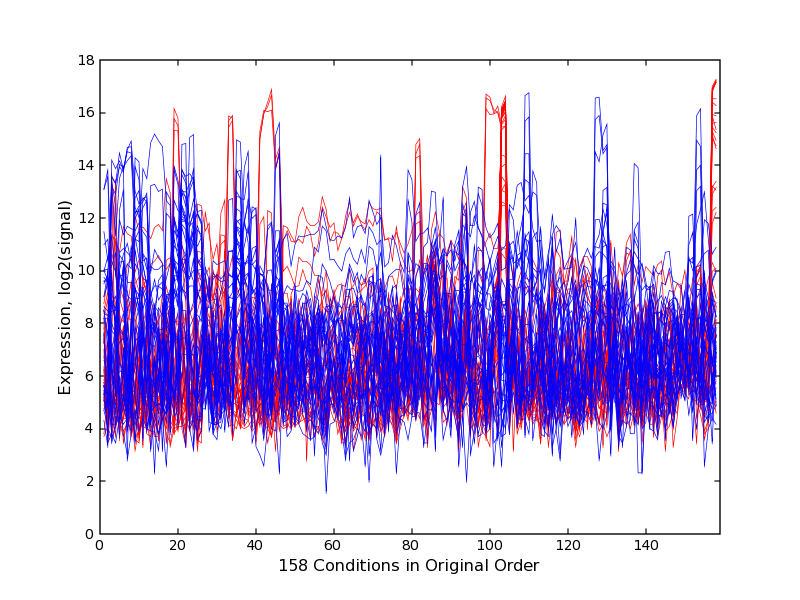
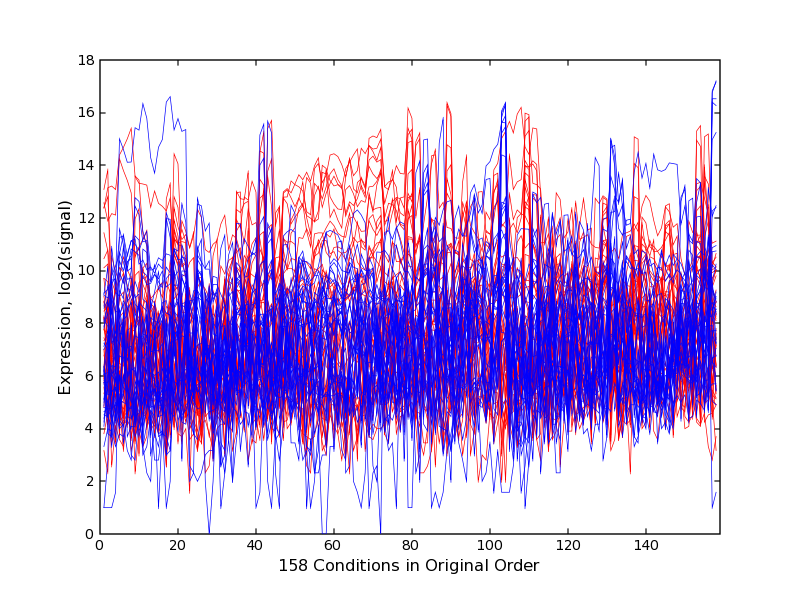
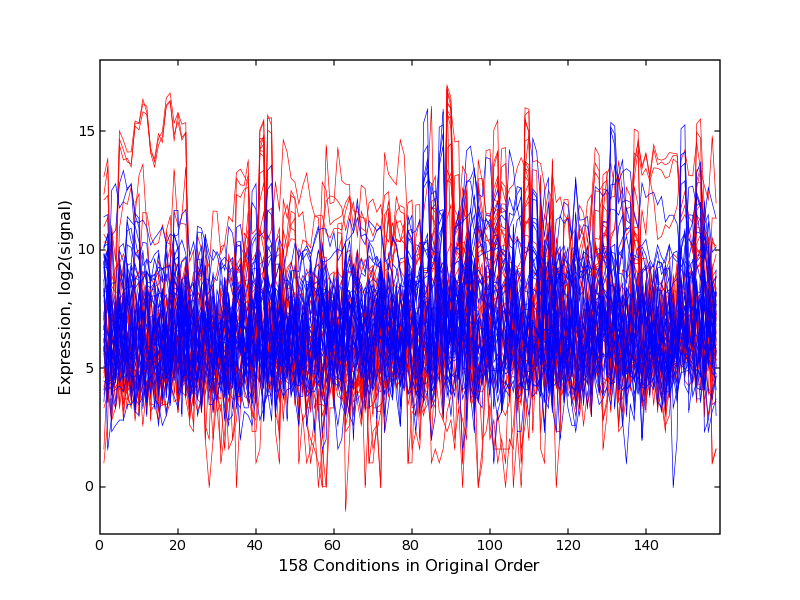
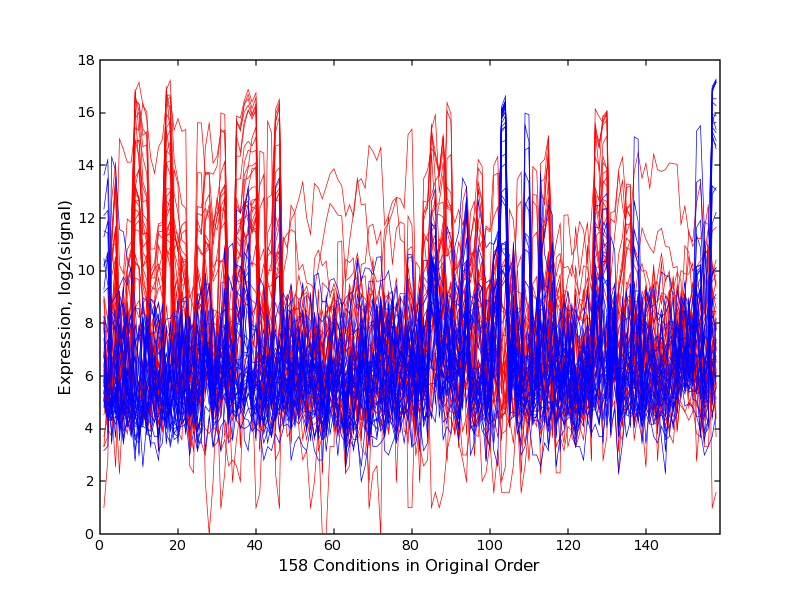
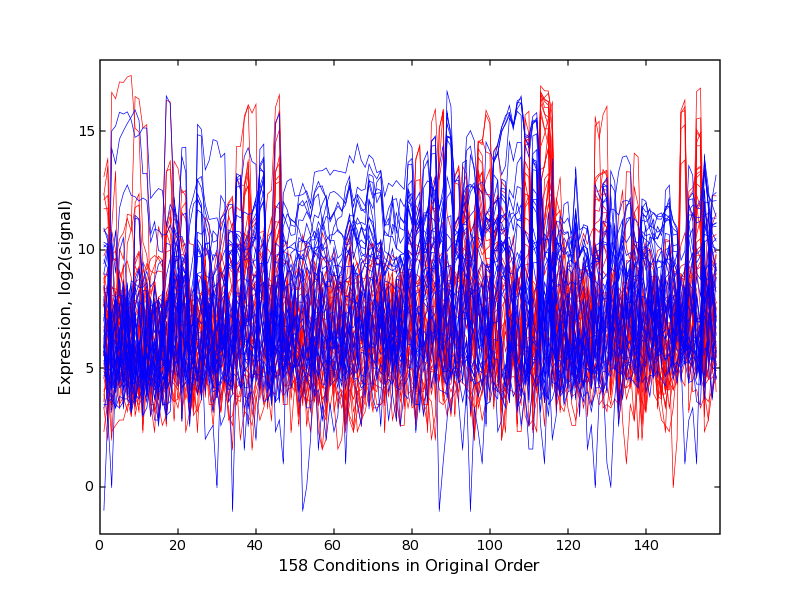
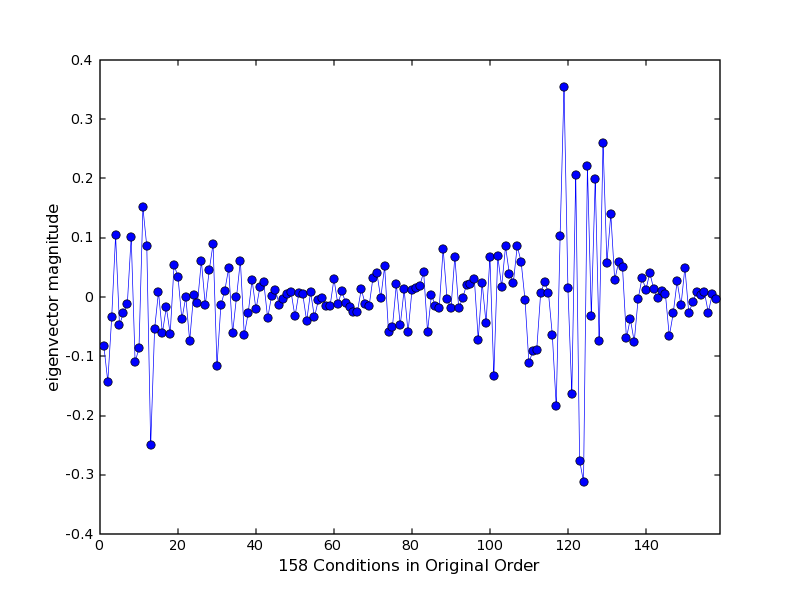
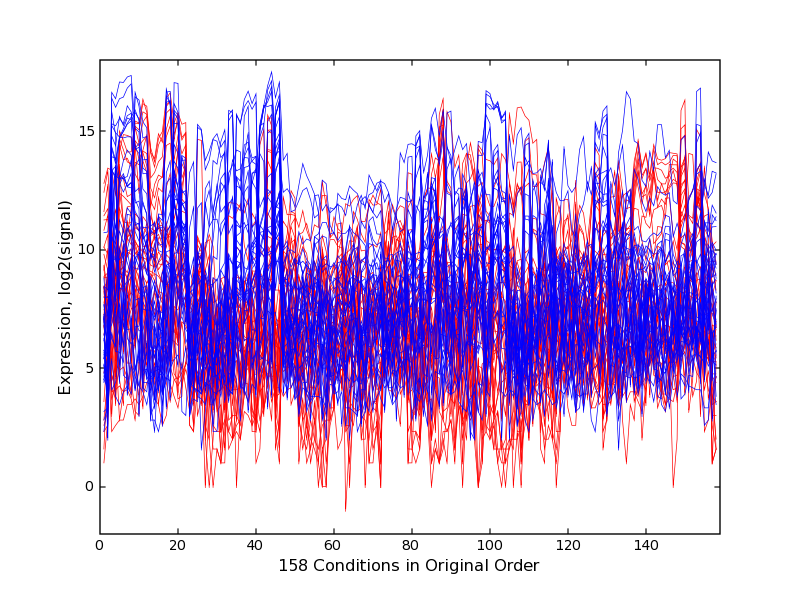
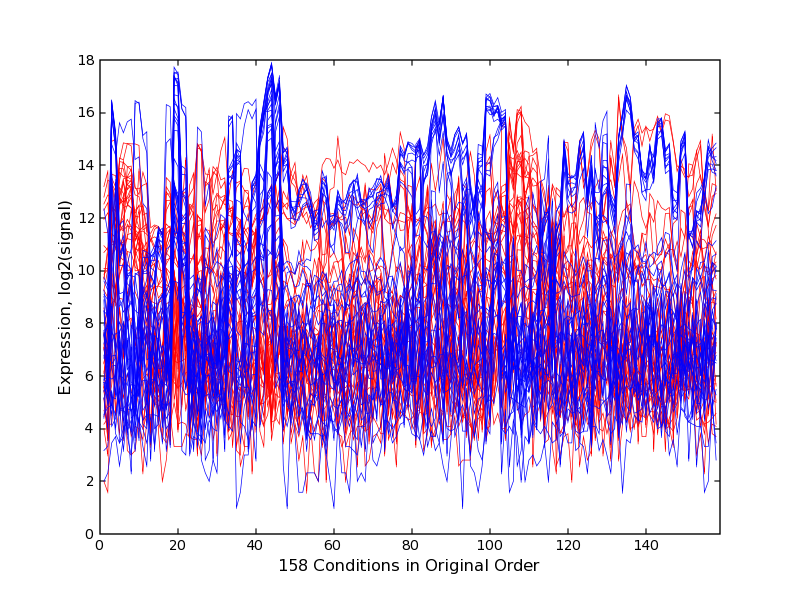
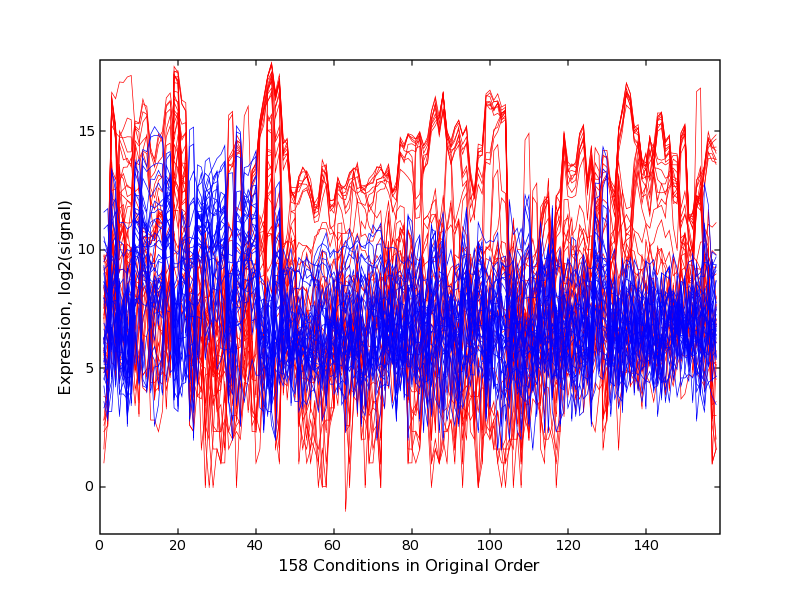
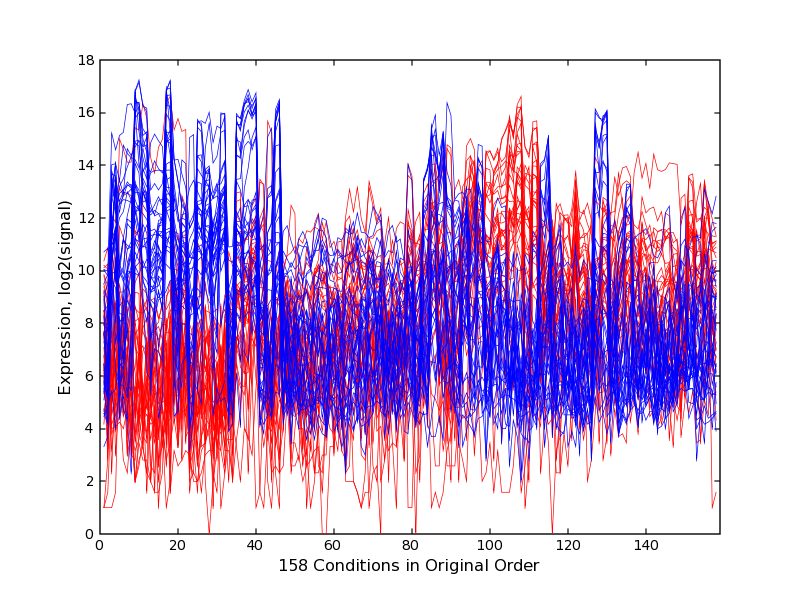
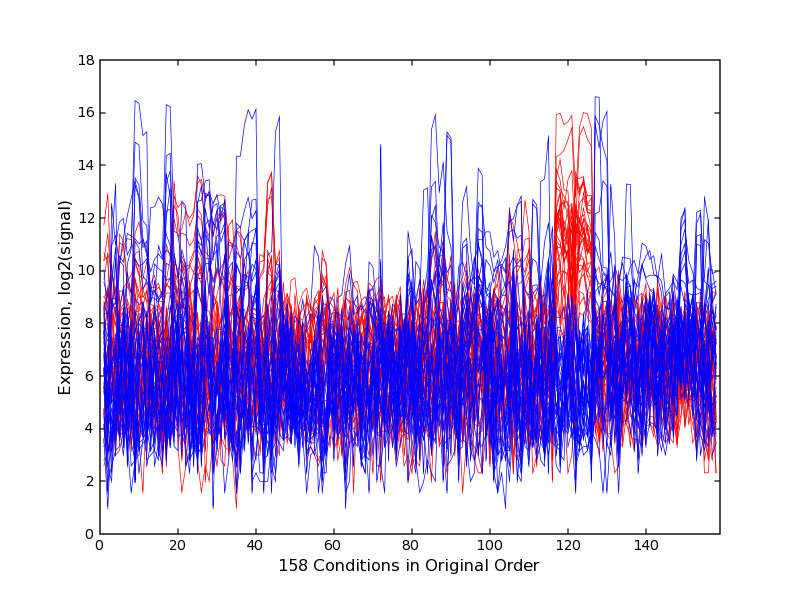
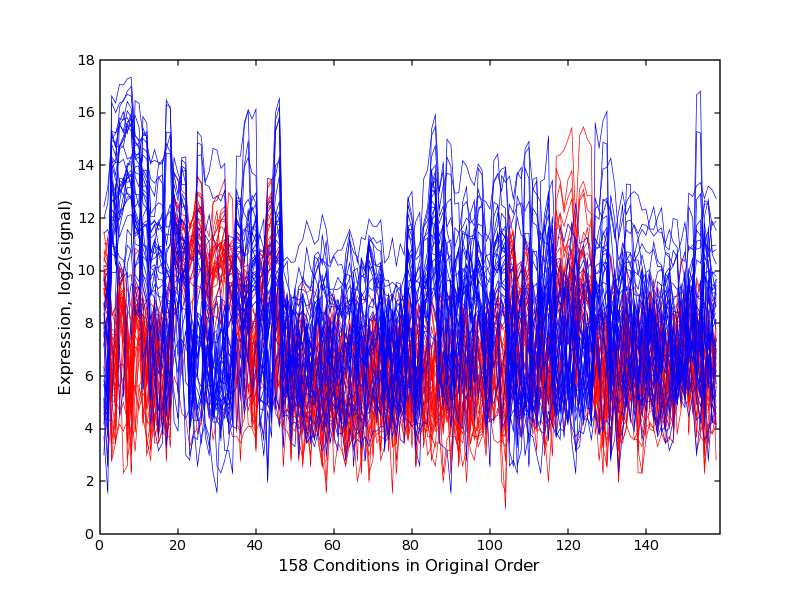
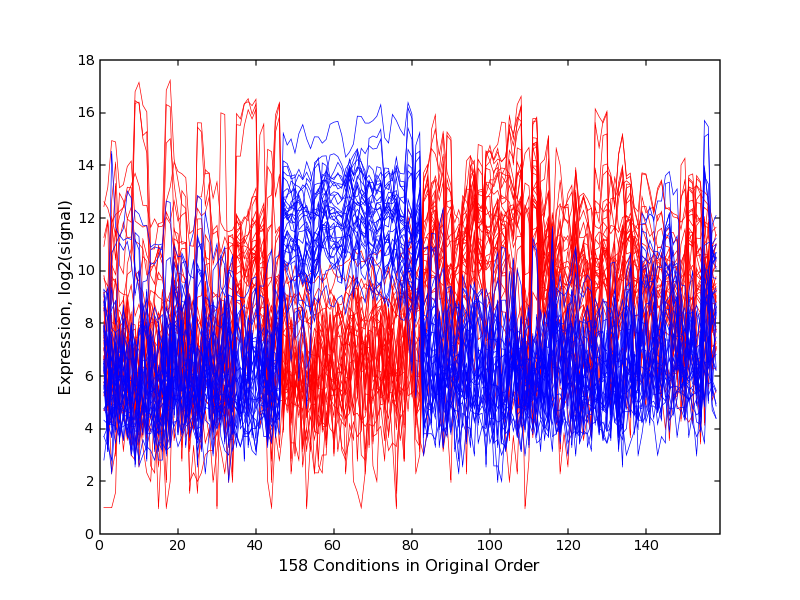
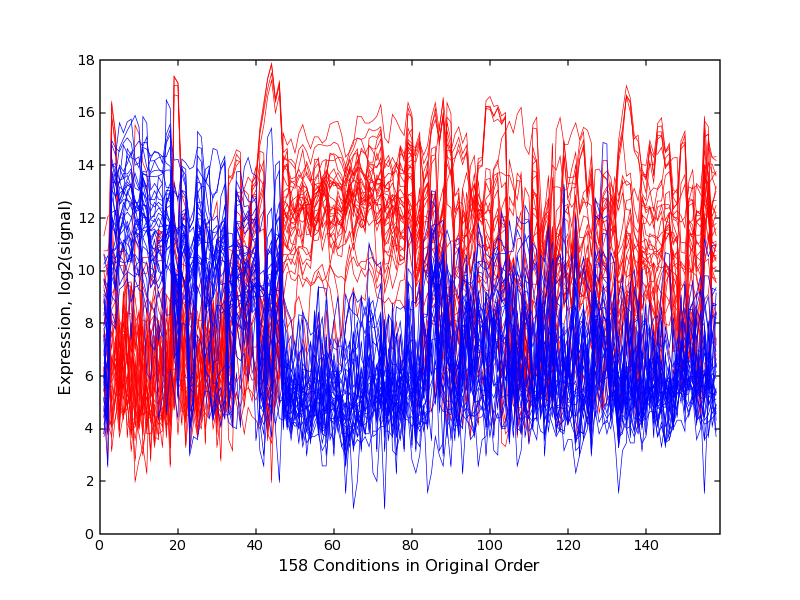
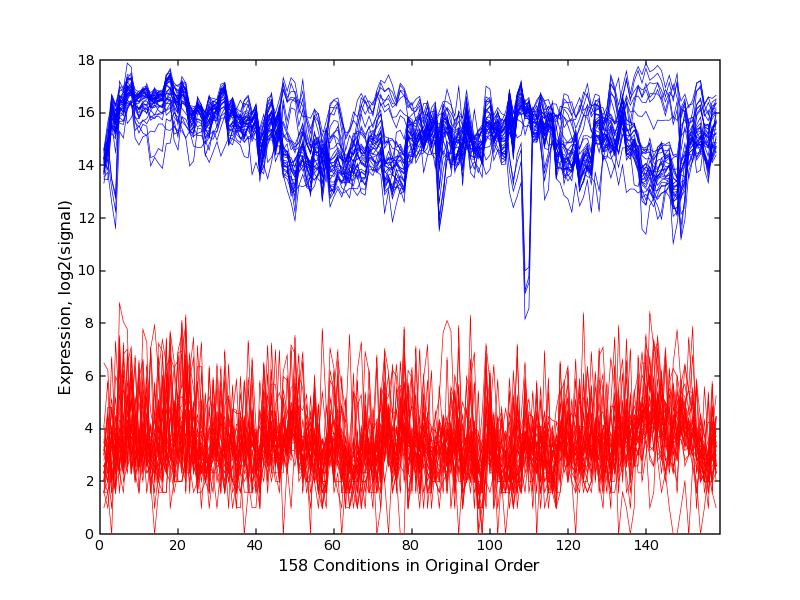
| pcNN-outlier-trajectories-order-original.png | Trajectory plots for high and low outlier sets with tissues in the order in which the original data were provided. |
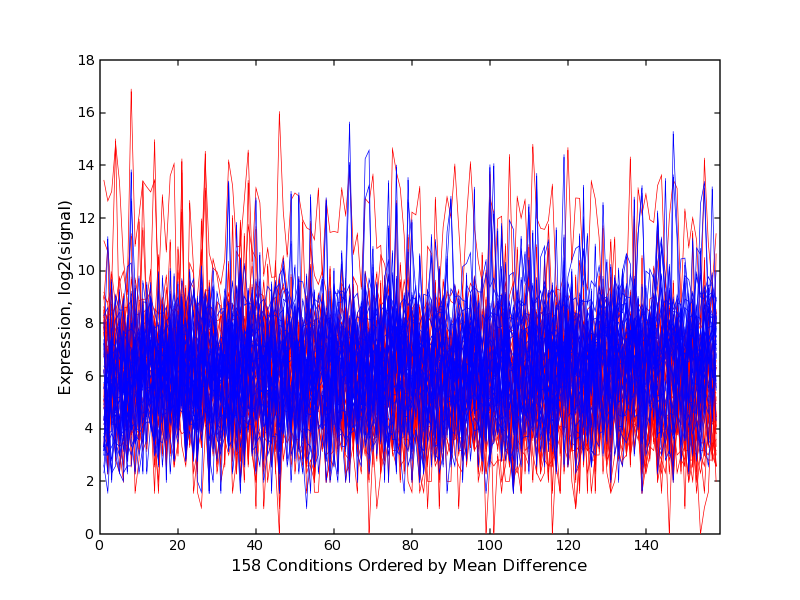
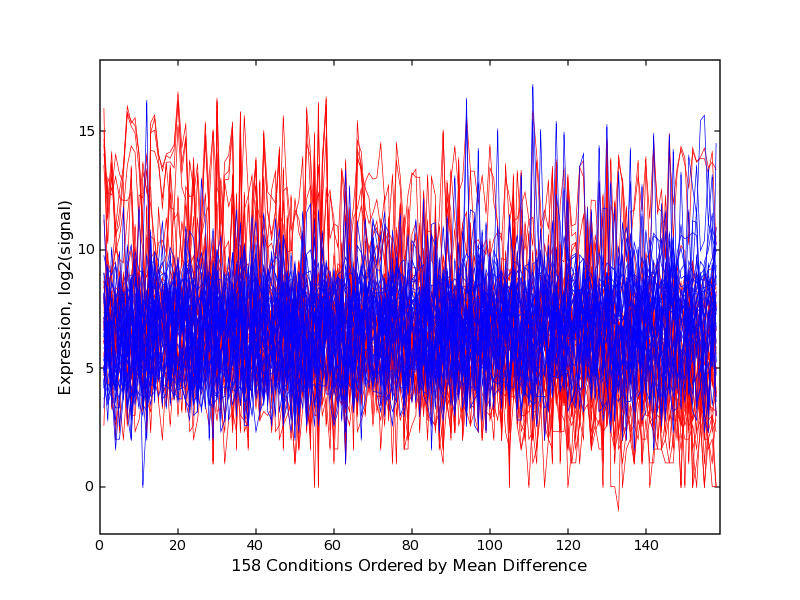
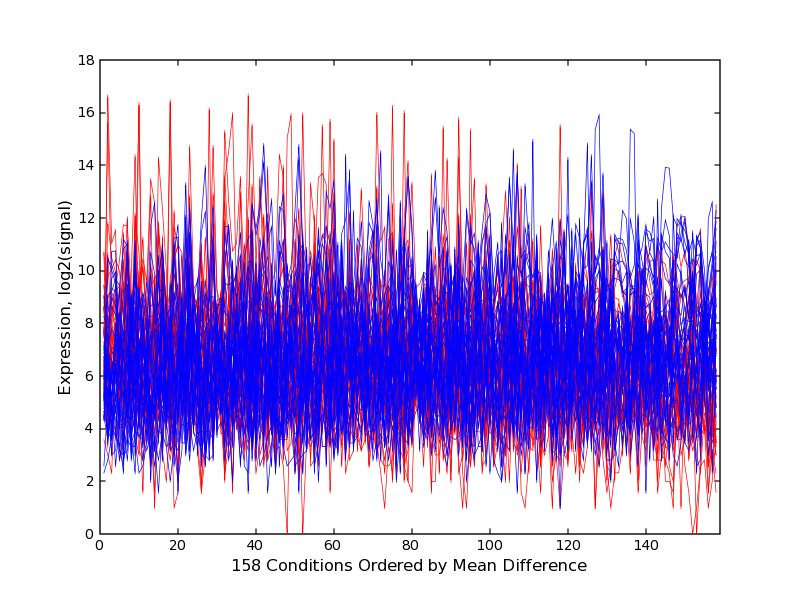
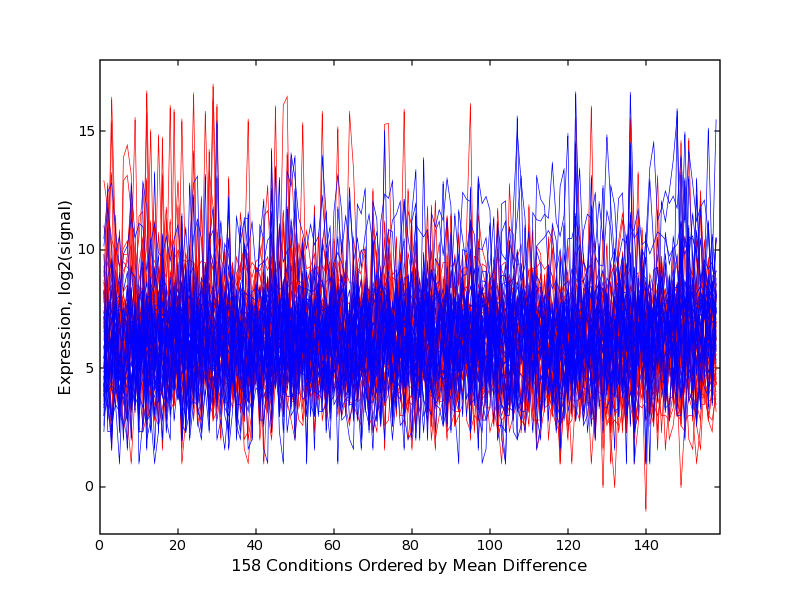
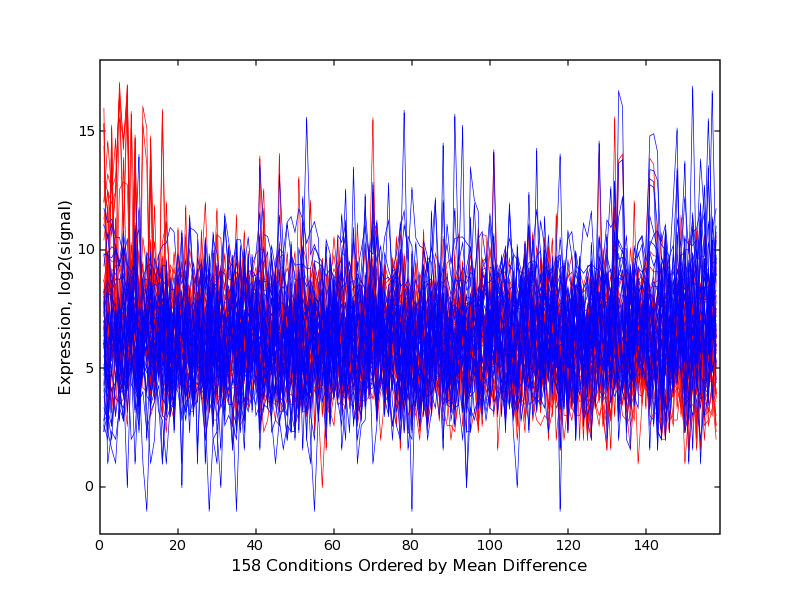
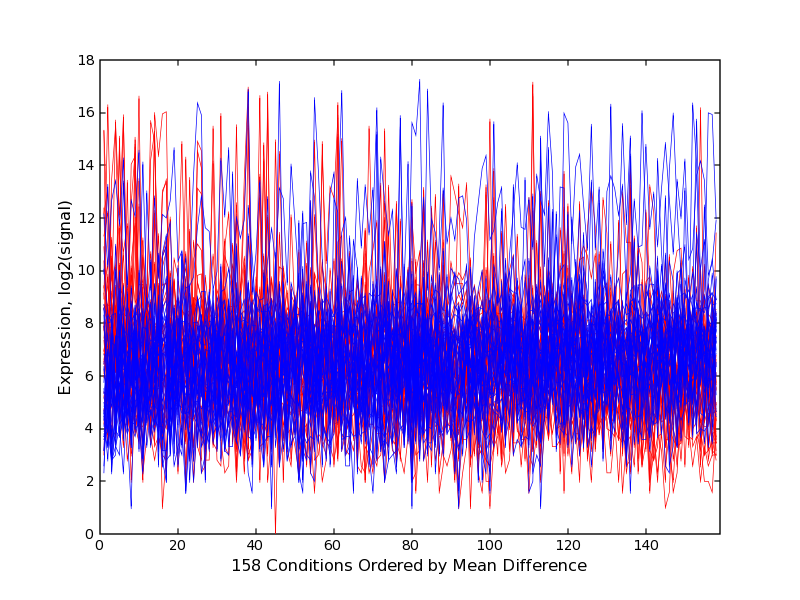
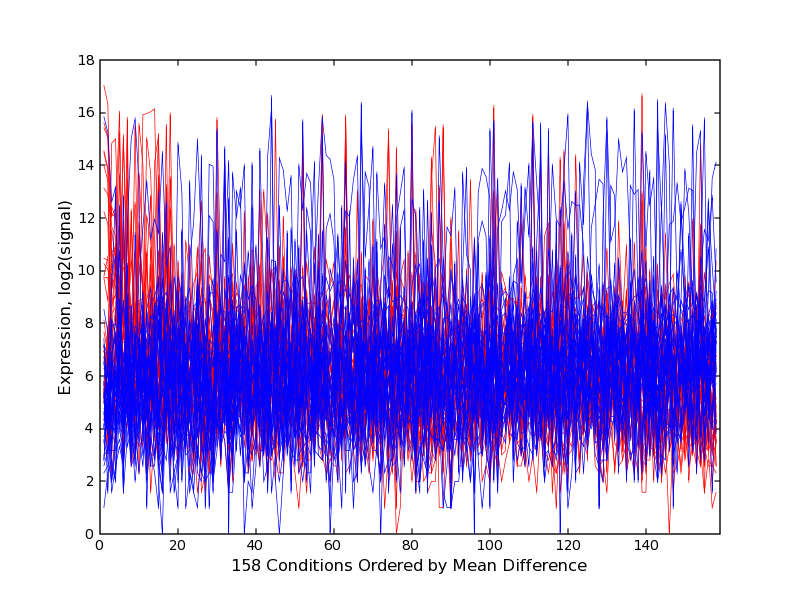
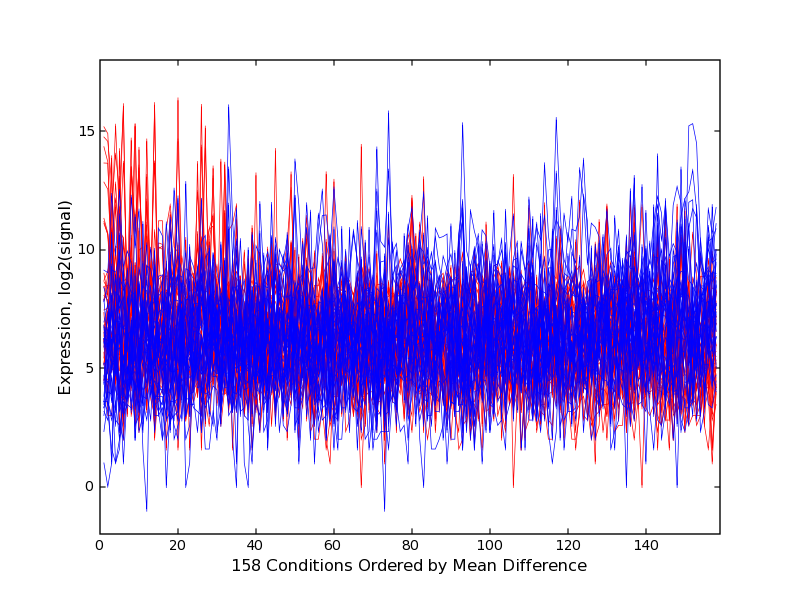
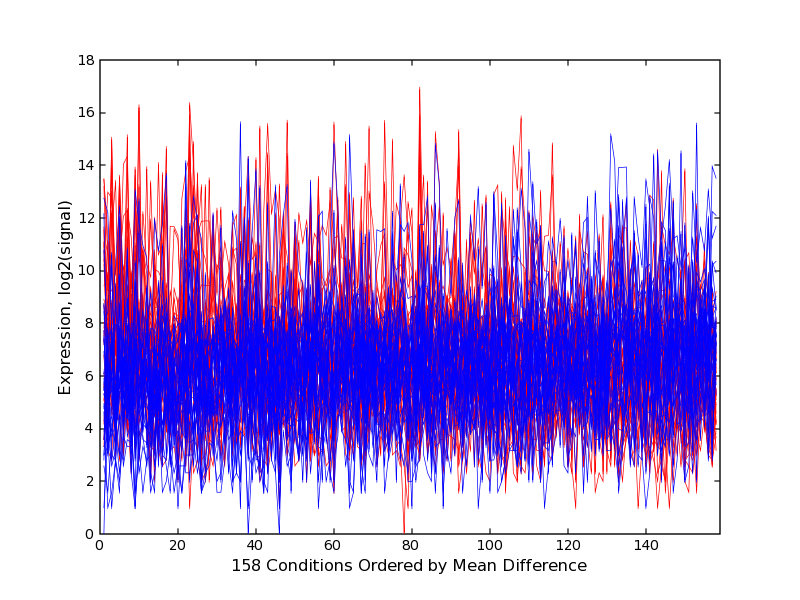
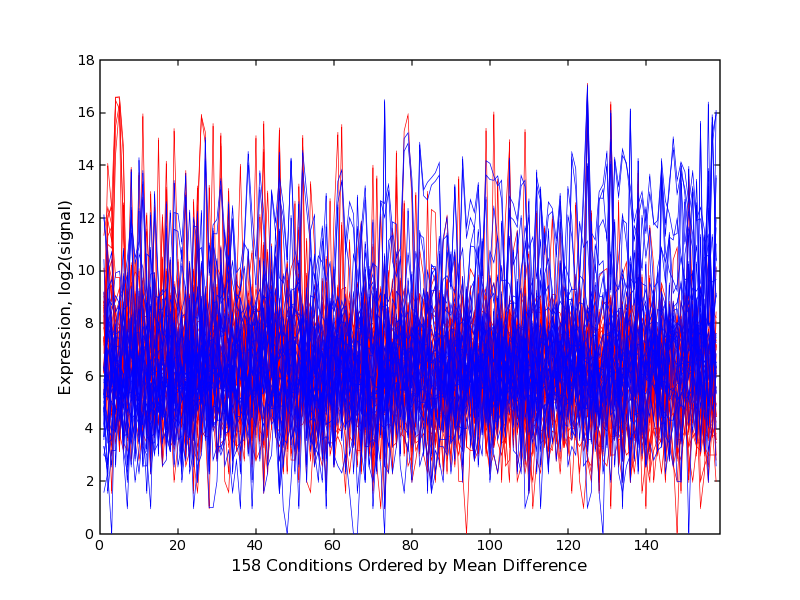
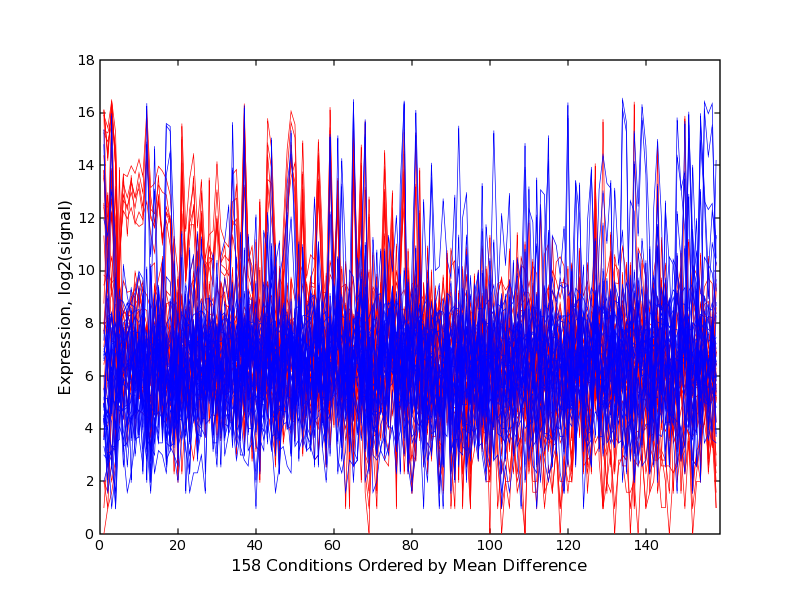
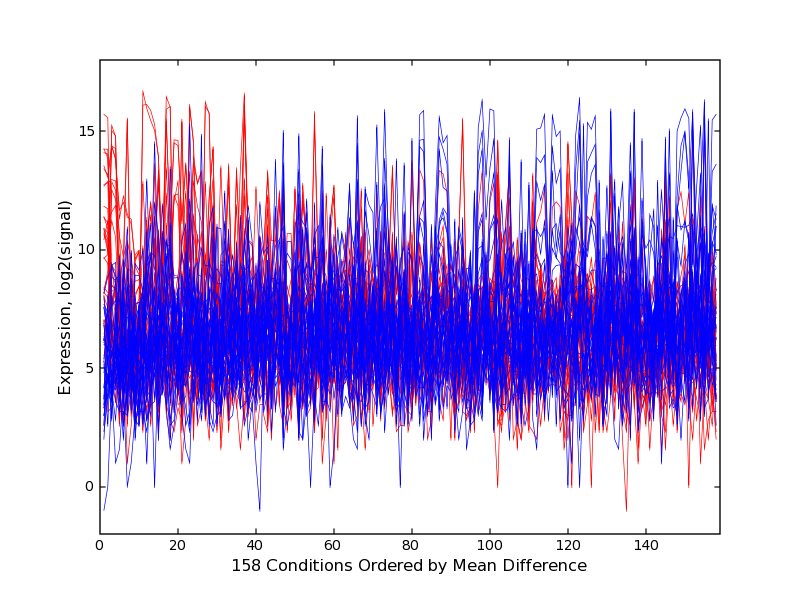
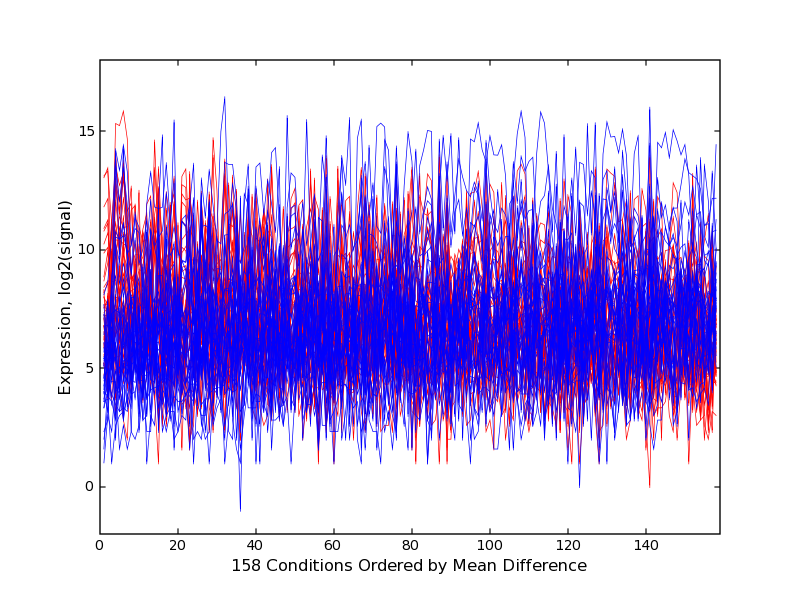
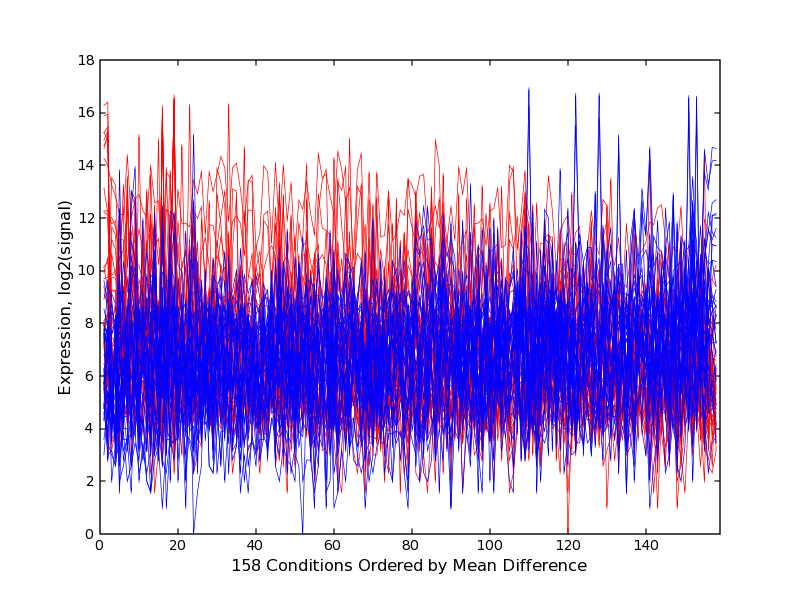
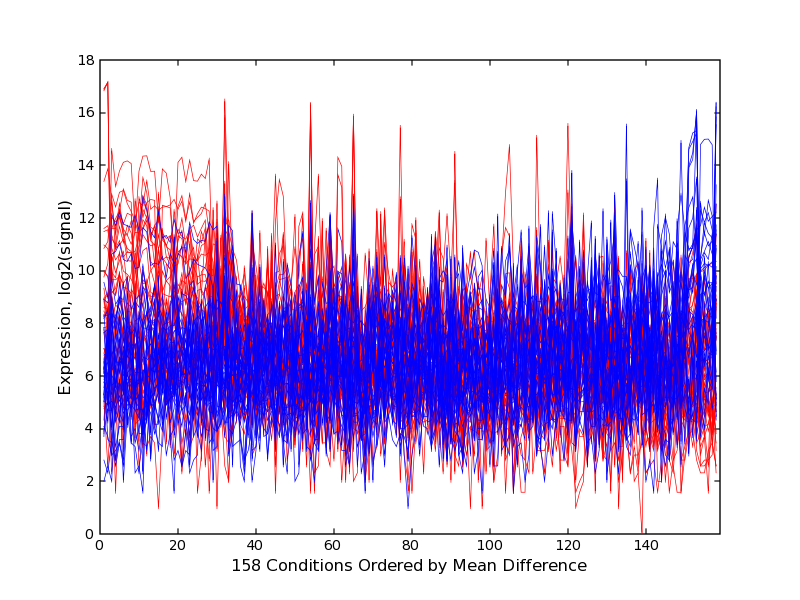
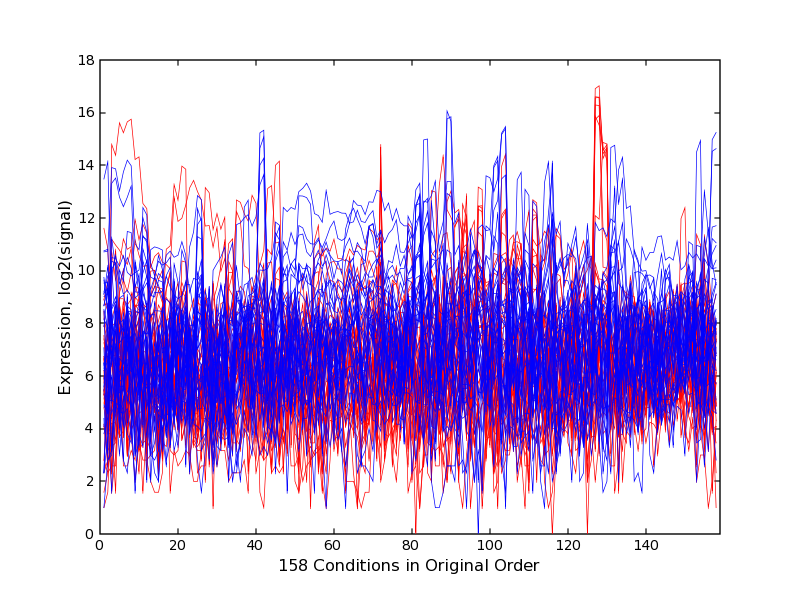
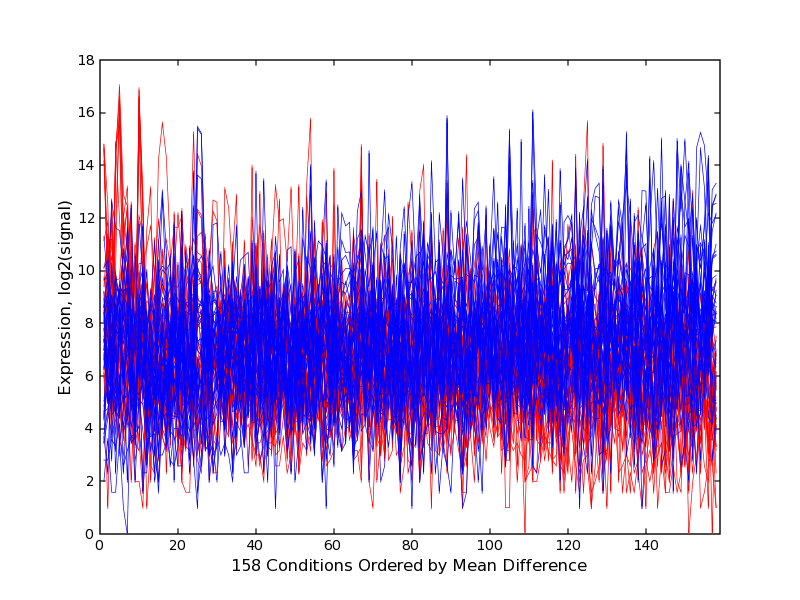
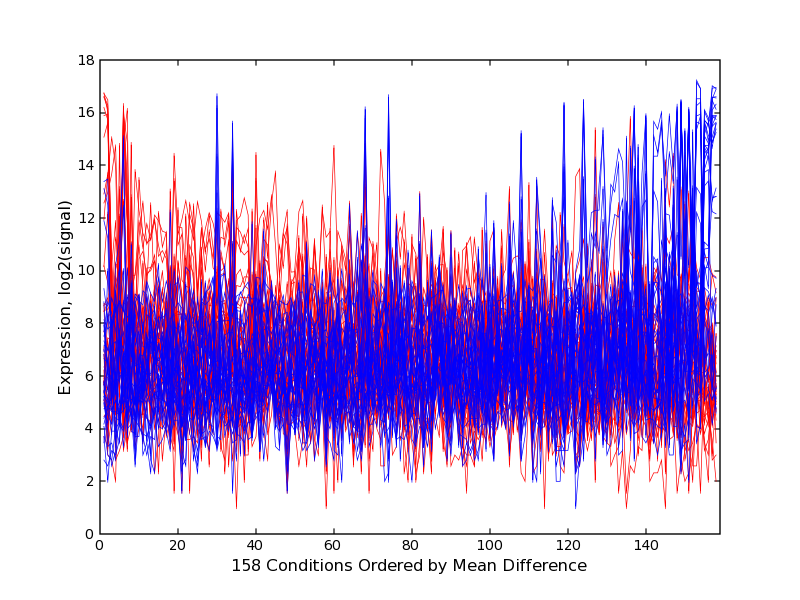
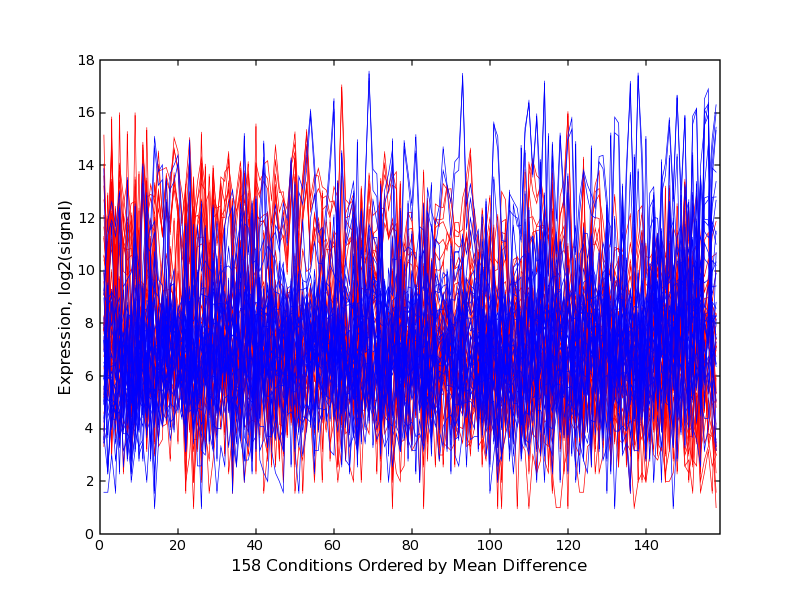
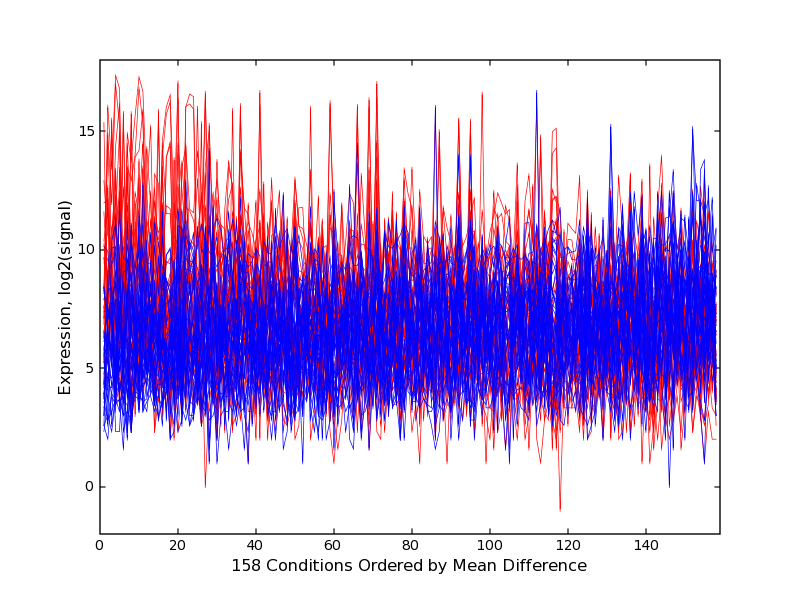
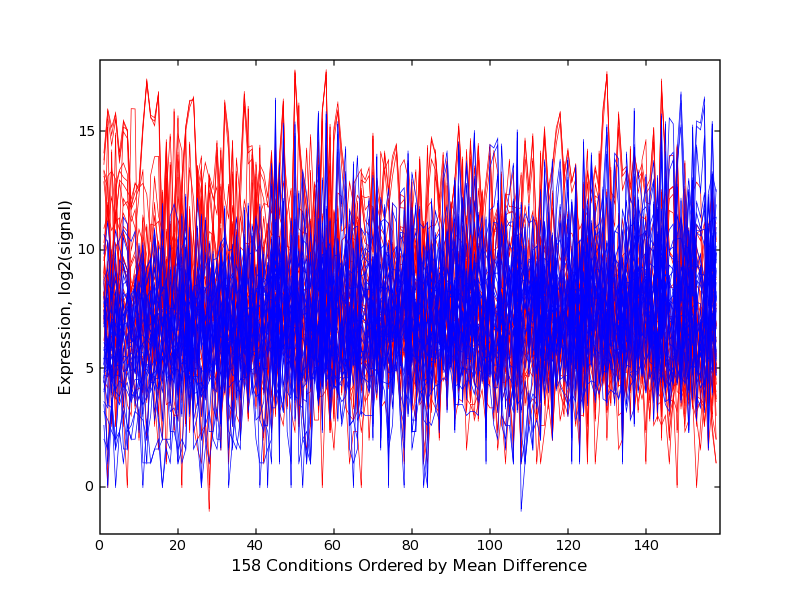
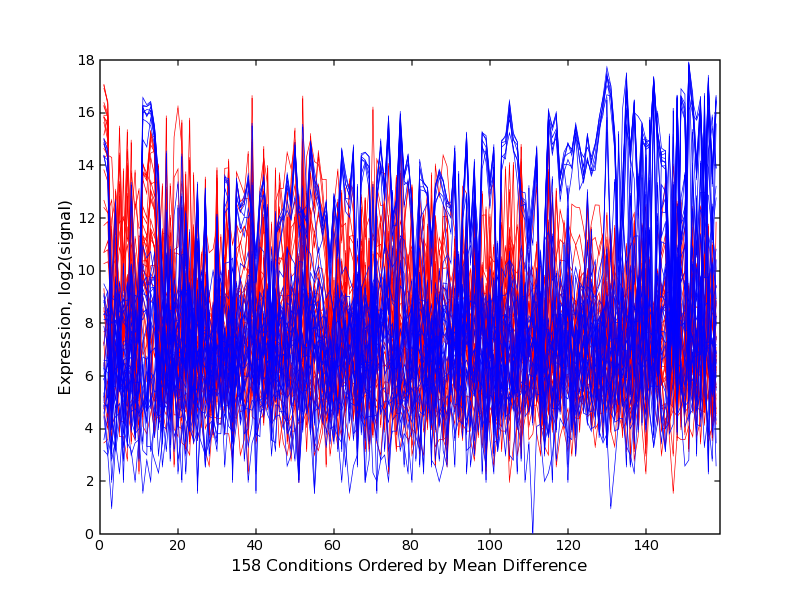
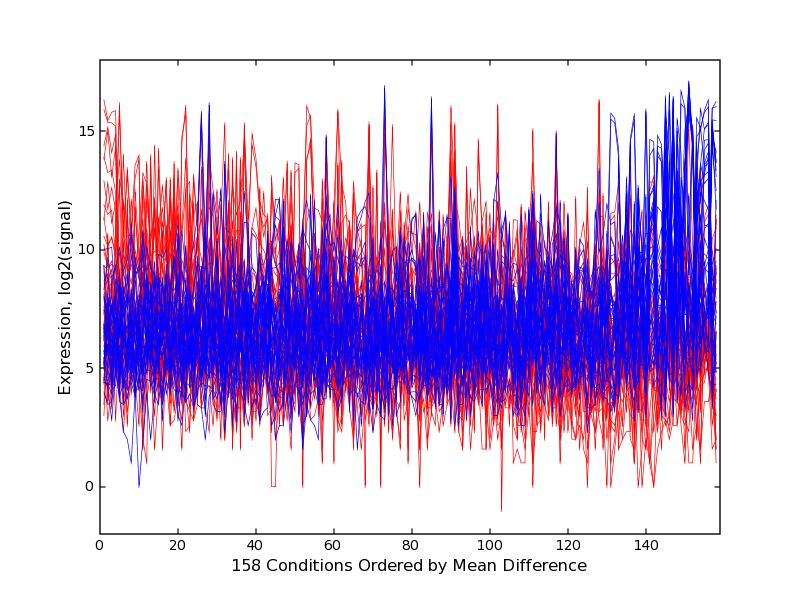
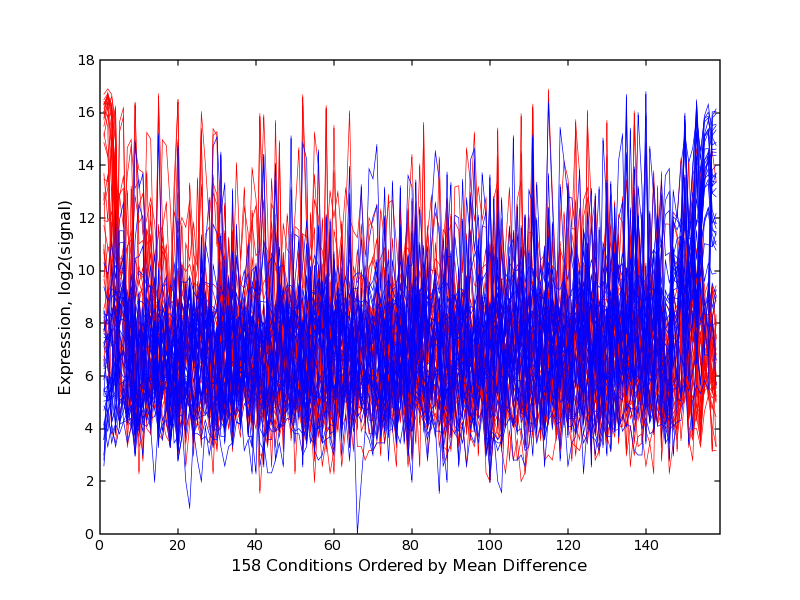
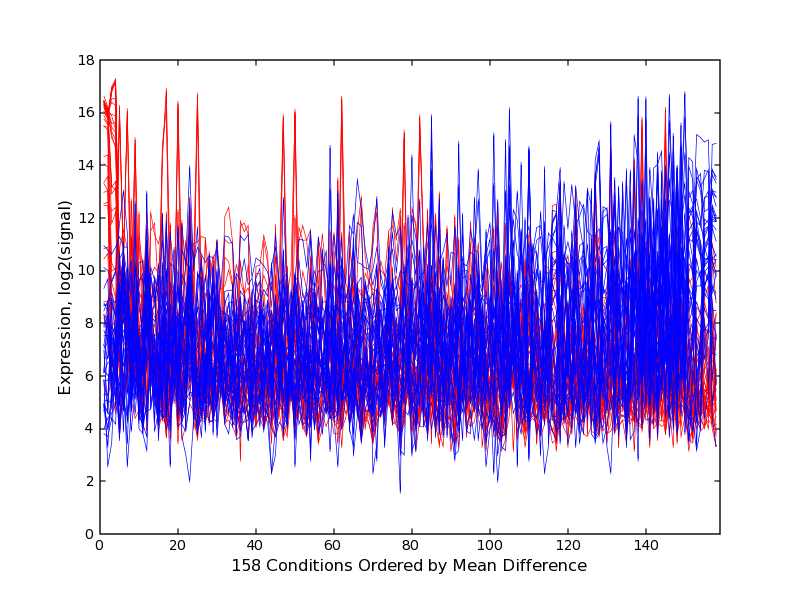
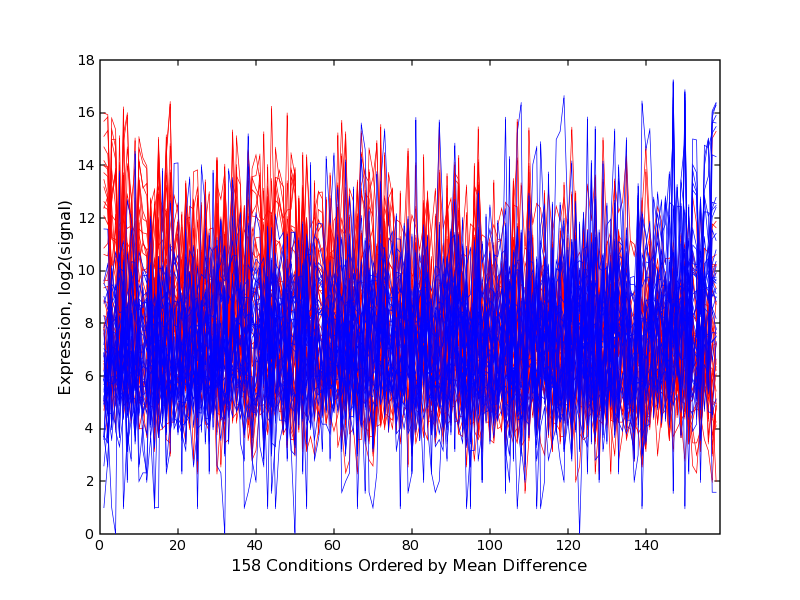
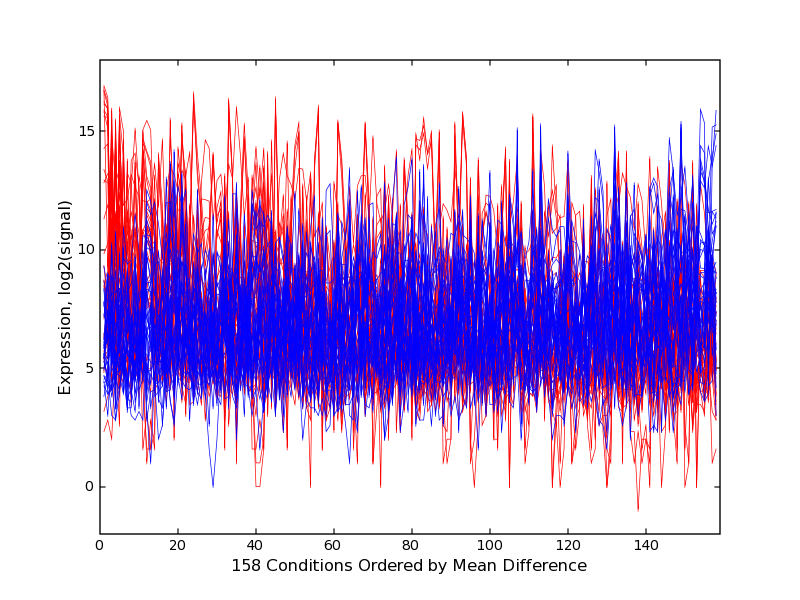
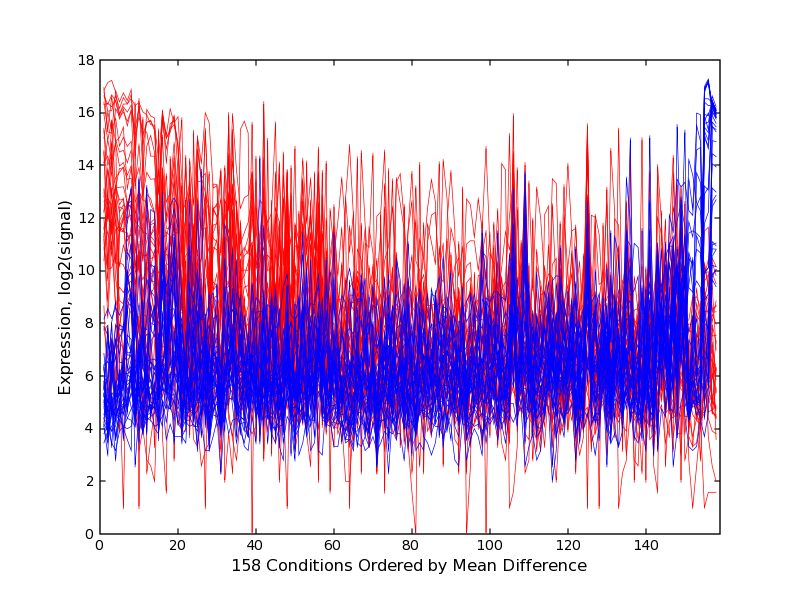
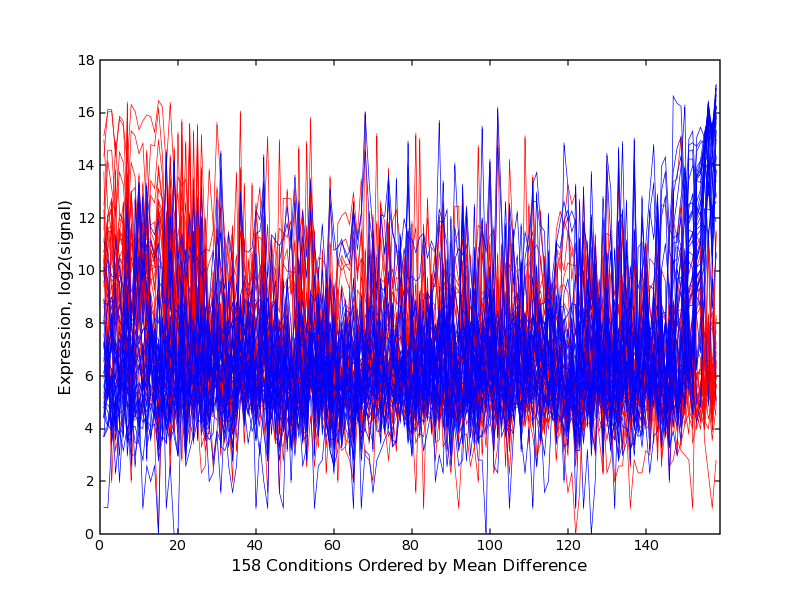
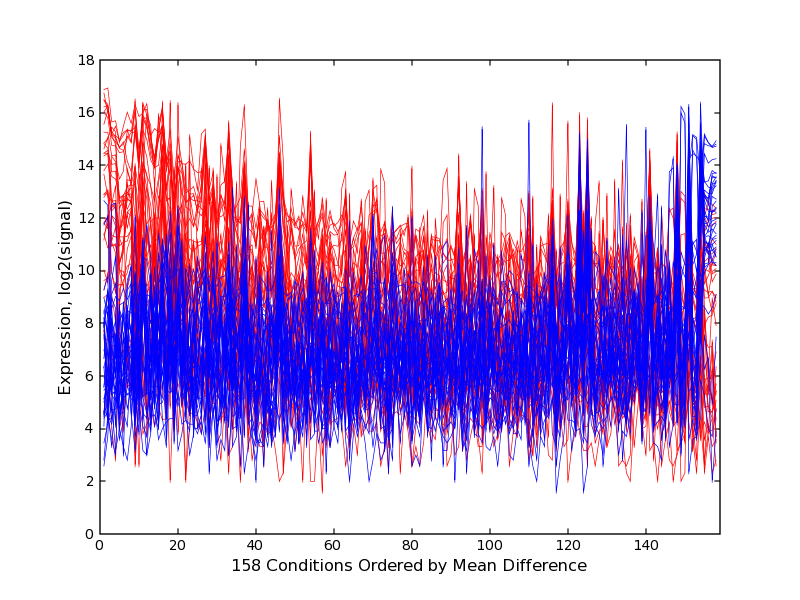
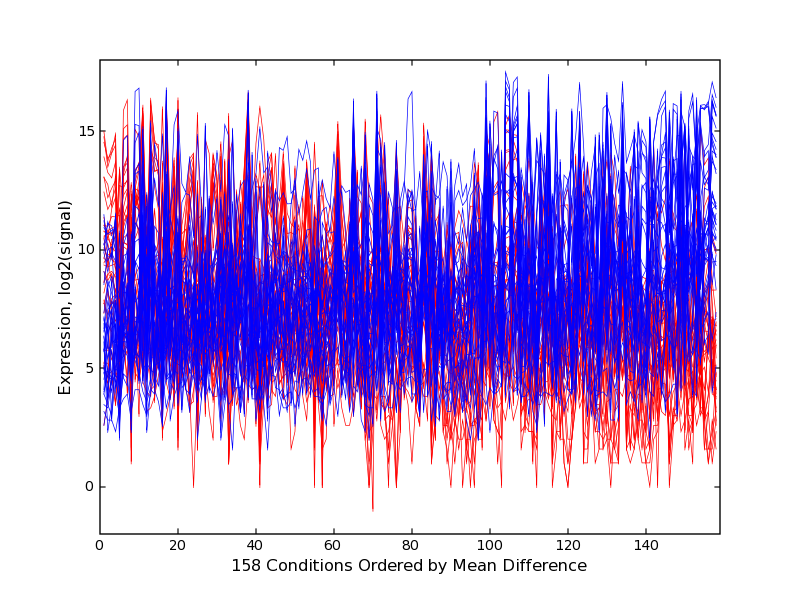
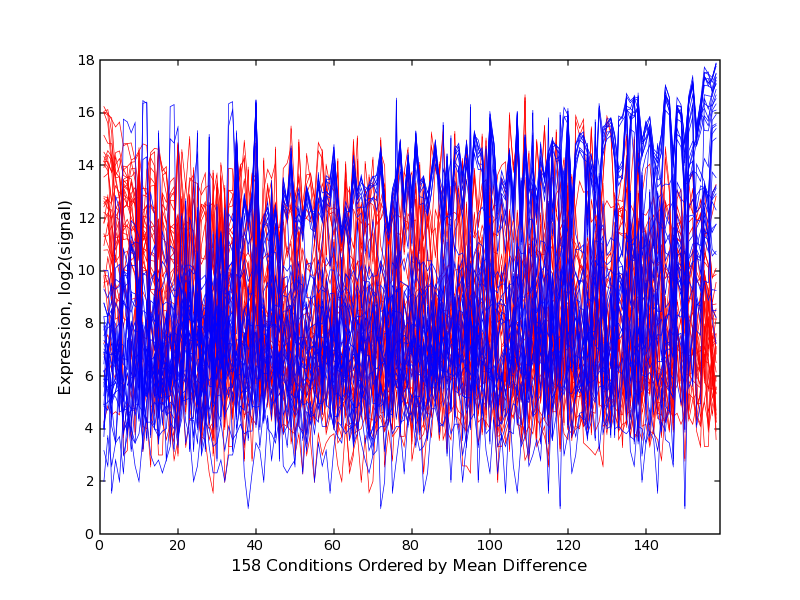
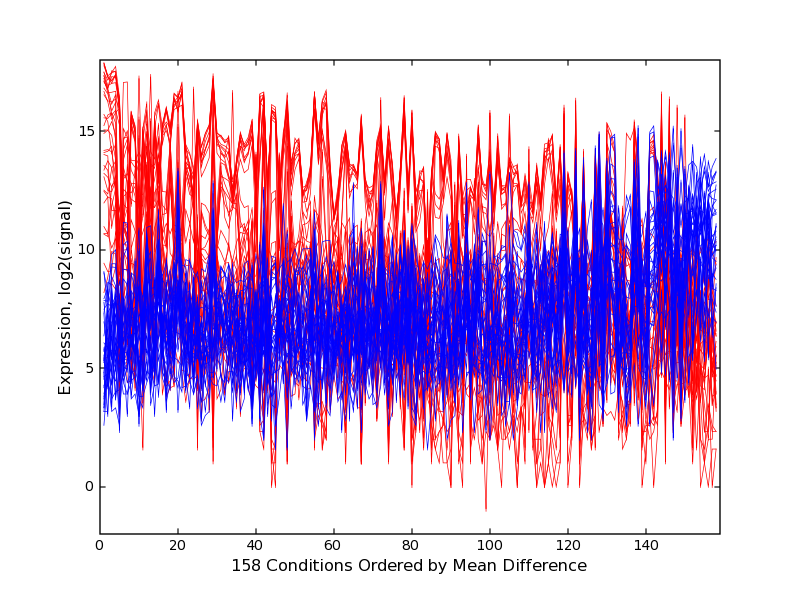
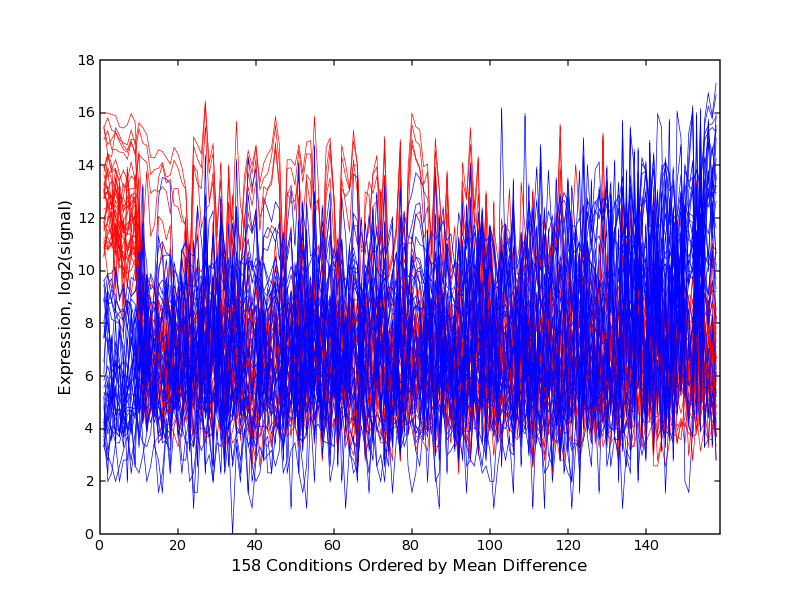
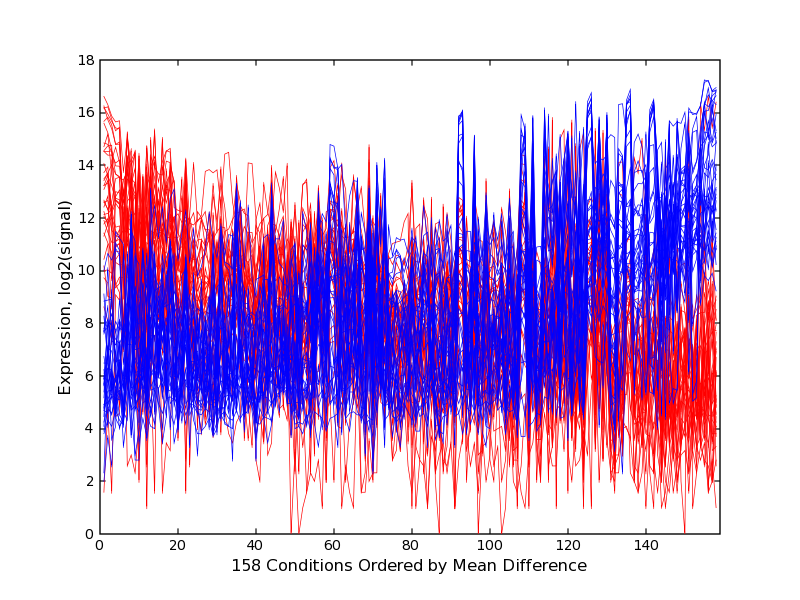
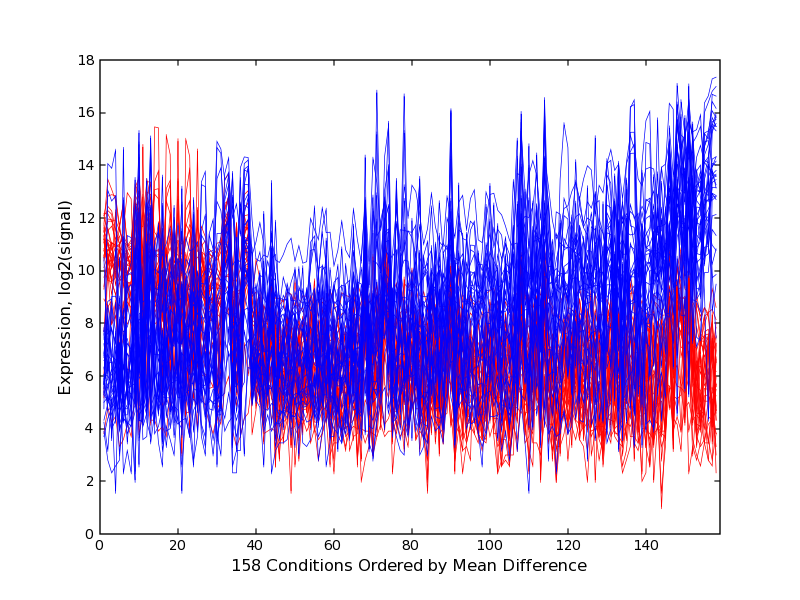
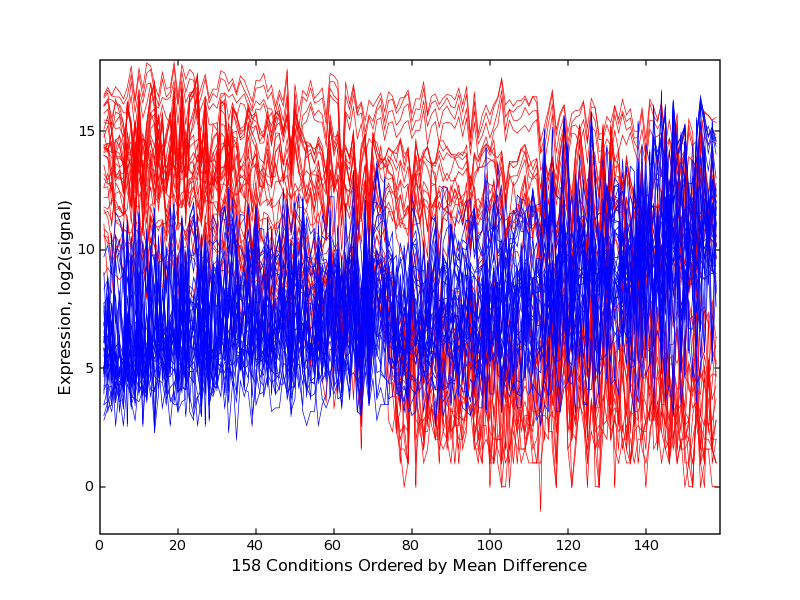
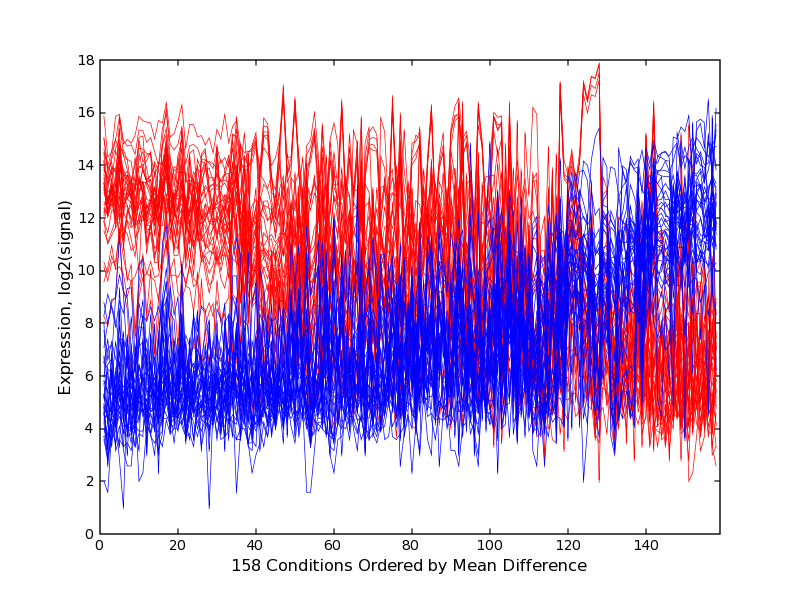
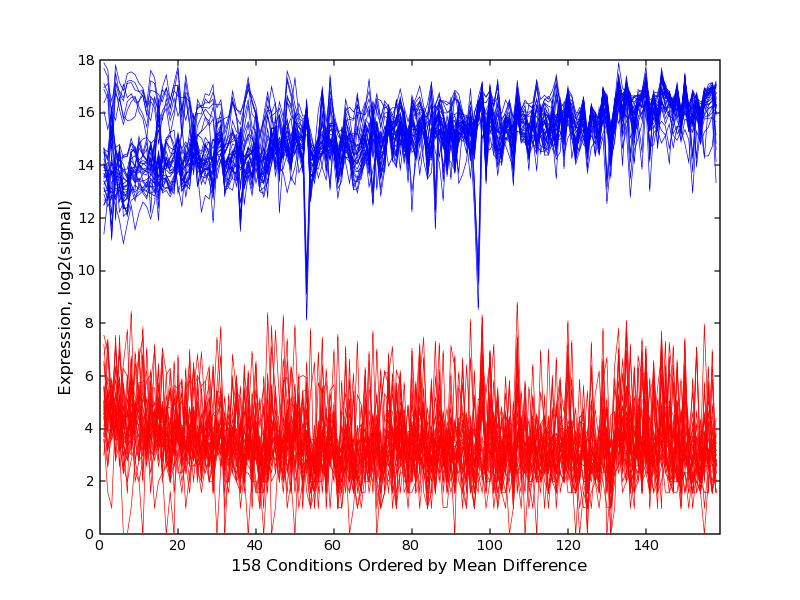
| pcNN-outlier-trajectories-order-meandiff.png | Trajectory plots for high and low outlier sets with tissues ordered by decreasing mean differences, and thus grouped by significance (up group at left, flat group in middle and low group at right). |